
4 min read
One of my favorite personal finance sites I’ve discovered in the past year is Financial Toolbelt. According to their bio:
We are trying something new in the personal finance space. We want to provide the best tools in personal finance and embed our data, graphs, and findings into our content.
That means no more static calculators or boring content. On this site you will find tools that can provide real steps to help you improve your situation and inside of our posts or interviews you will see useful graphs to help give more context.
As someone who likes to make interactive tools and data visualizations myself, I geeked out when I found this site. One of my favorite tools they provide is called the Career Database, which is a massive searchable database that provides you with the following information for over 550 different careers:
- Median U.S. salary
- Minimum education requirement
- Projected job growth from 2016 to 2026
- Median salary by state
- Cities with most jobs available for a particular career
- 10 highest paying cities for a particular career
- Exactly how much of each bi-weekly paycheck you would need to contribute to max out a 401(k) over the course of a year
This tool is incredibly useful for young people who are unsure what career path they want to pursue and want to know what the job prospects and potential income looks like for various careers.
It’s also useful for anyone who is looking to transition careers and wants to know where they can move to earn a higher income, what type of education they need to pursue to land a job in a new role, etc.
I’m not currently looking to transition careers, but I’ll walk through an example of how I would have used this tool a few years ago when I was just starting college and when I was unsure about what potential career path to pursue.
Becoming a Statistician
In my early years of college, I declared my major to be statistics. I didn’t actually know much about the field, but I knew I was good with numbers and I knew that stats was a niche field that offered high salaries.
Here is how I would have used the Career Database to learn a bit more about the employment prospects of statisticians.
First, I would have searched “statisticians” in the search bar, which fortunately is one of the careers in the database:
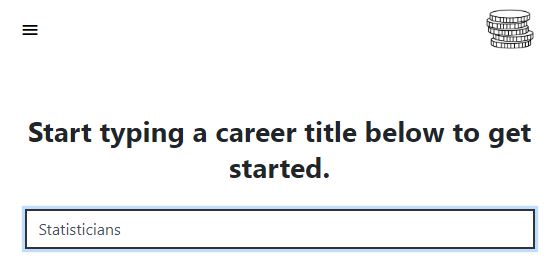
Note: One neat feature of this database is that when you start typing the name of a certain career, various career names automatically show up as search recommendations.
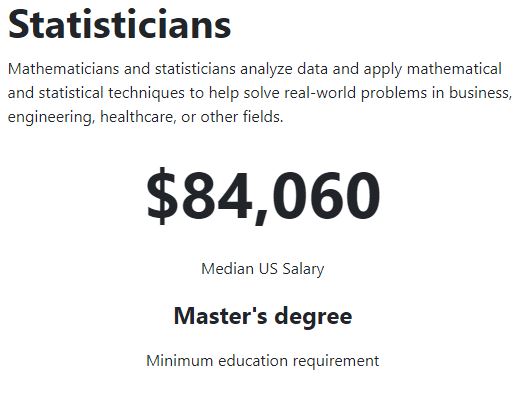
Once I click enter, a page appears that gives me a plethora of information about statisticians. First, I see a brief job description along with the median U.S. salary and the minimum degree required to become a statistician:
Next, I see the employment outlook for statisticians:
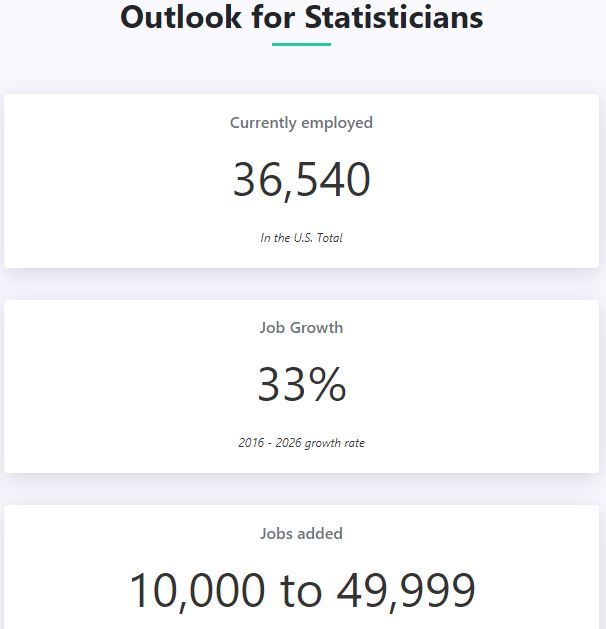
The number I’m mostly interested in is the job growth percentage, which tells me whether or not this is a career that’s expected to offer growth opportunities over the coming years or not. Fortunately, 33% is an incredibly high number, which is a good sign. Careers that are expected to experience high growth are often careers that will offer high compensation.
Next, I can see a heatmap that displays the median salary for each state in the U.S. for statisticians.
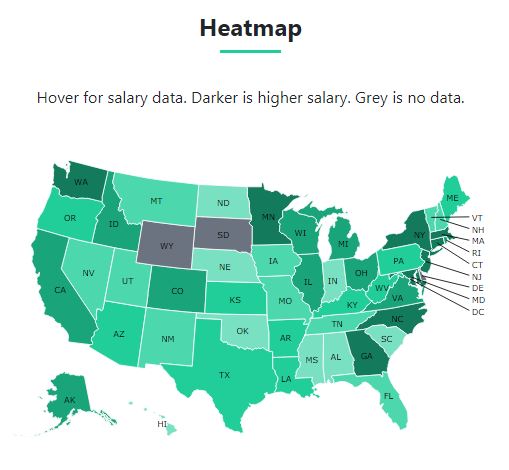
This map is interactive, so I’m able to hover over various states and see the median salary for those states.
A quick glance at this map shows me that my home state of Ohio offers higher median salaries than all of its surrounding states including Indiana, Kentucky, West Virginia, Pennsylvania, and Michigan.
Next, another map shows me the cities with the most jobs for statisticians across the U.S.
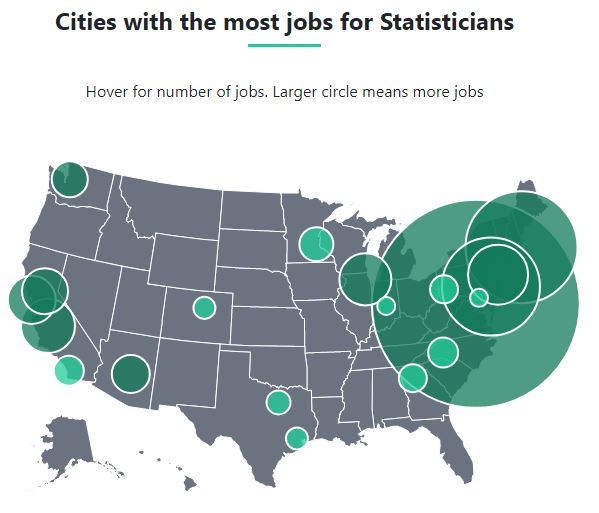
The size of the circles in the map represent the number of statistician jobs in that particular city. This map is also interactive, so I’m able to hover over the circles and see the actual city names.
I can see very clearly that the cities with the most statistician jobs are generally located on the western coast of California and the northeast coast, with some other cities sprinkled throughout like Phoenix, Seattle, and Minneapolis.
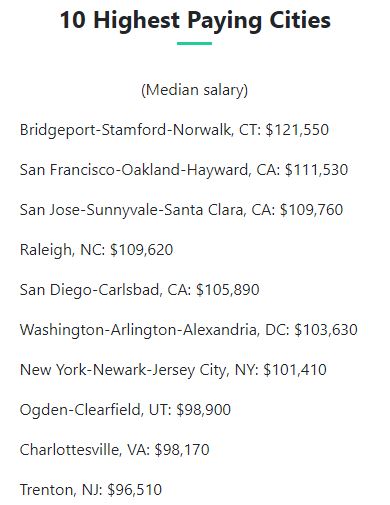
Along with this map, I’m given a list of the 10 highest paying cities, based on the median salary for statisticians. The city name and the median salary are both listed:
Lastly, I’m given a neat table that shows how much I would have to contribute from each biweekly paycheck to max out my 401(k), assuming I earned the median salary for a statistician:
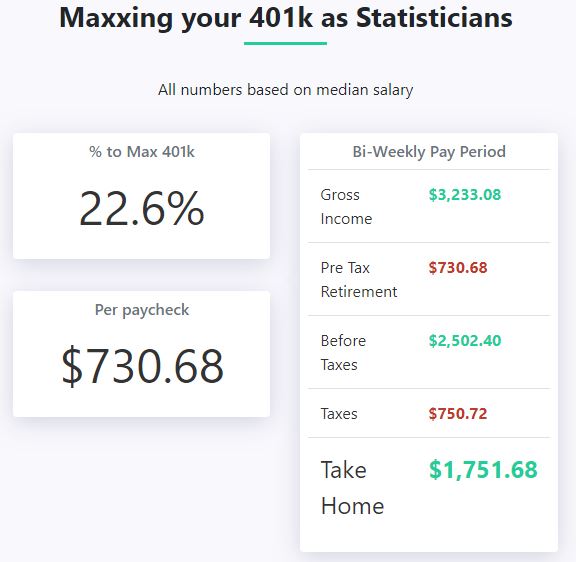
This table is especially useful for us personal finance nerds who want to see exactly how much we could take home from each paycheck, after maxing out our contributions to a 401(k).
At the very end of the page is a list of four related careers:
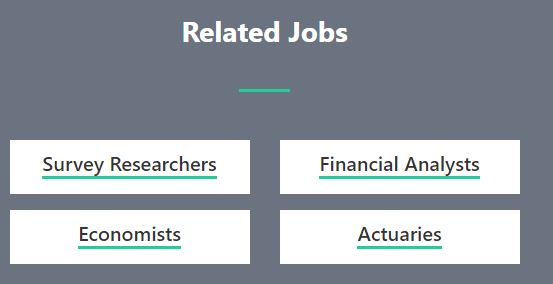
I like this feature of the database because it gives me a few more careers to explore that are in a similar to statisticians. This way, I can compare the employment outlook and potential income of other careers to that of a statistician.
A Wonderful Starting Point
This career database offers a wonderful starting point for anyone who is interested in learning more about potential career paths. But keep in mind that choosing a career that suits you is about more than just identifying the highest growing field with the highest median salary.
For example, you may want to do some research on job satisfaction of various careers. You may also want to look at how much debt you’ll have to take on, on average, to obtain the minimum degree required to enter a certain field.
In addition, it’s important to recognize that a high income doesn’t necessarily translate to a high take-home pay. Of course you’ll earn a higher income in places like California and New York, but to get an idea of how much of that income you’ll actually keep after expenses, it’s important to analyze the cost of living in different places.
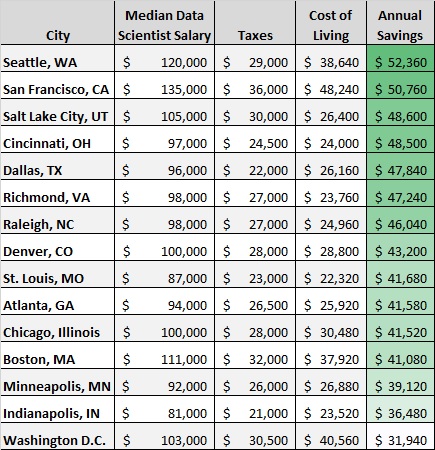
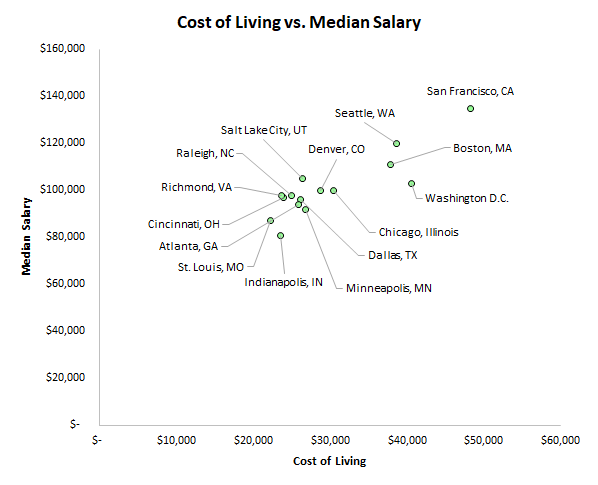
Nerdwallet offers a fantastic tool that lets you compare the cost of living between two different cities so you can gauge how much of your income you’ll be able to keep after expenses. I used this exact tool in a post where I explored the salaries of data scientists and cost of living in various cities around the U.S.
This helped me realize that although I could probably earn a higher salary in places like Denver, Chicago, or Boston, it was unlikely that I could actually save more of that income each year compared to my current city Cincinnati.
So, if you’re interested in exploring different career paths, I recommend starting with the Financial Toolbelt Career Database.
And to explore the cost of living in different areas, I recommend the Nerdwallet Cost of Living Calculator.
Using these tools, you can find a career with a healthy employment outlook and decent income, along with a suitable place to live where you can save a decent chunk of that income.
- The Ad Revenue Grid - August 6, 2021
- Attract Money by Creating Value for a Specific Audience - July 13, 2021
- The 5-Hour Workday - March 26, 2021
Full Disclosure: Nothing on this site should ever be considered to be advice, research or an invitation to buy or sell any securities, please see my Terms & Conditions page for a full disclaimer.
