
6 min read
In 2018 the S&P 500 experienced a -4.38% return, the first down year since the 2008 financial crisis.
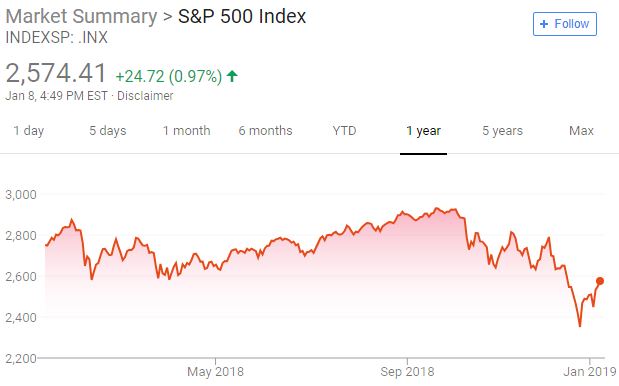
So, how should we expect the S&P 500 to perform in 2019?
Your guess is as good as mine. Nobody can predict how the stock market will perform in any given year. We can, however, look at historical returns and see how the S&P 500 has historically performed after a down year.
Analyzing Historical S&P 500 Down Years
Since 1928, the S&P 500 has experienced negative inflation-adjusted returns in 29 different years.
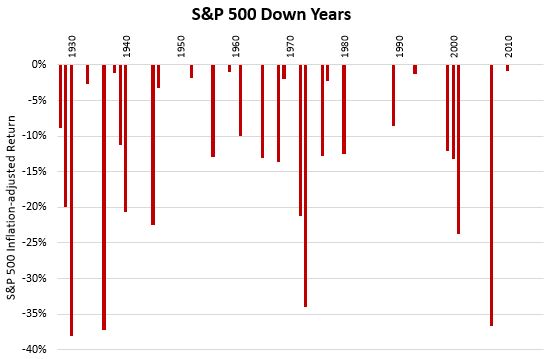
If we take each of these negative return years and sort them from worst return to best, here’s what that looks like:
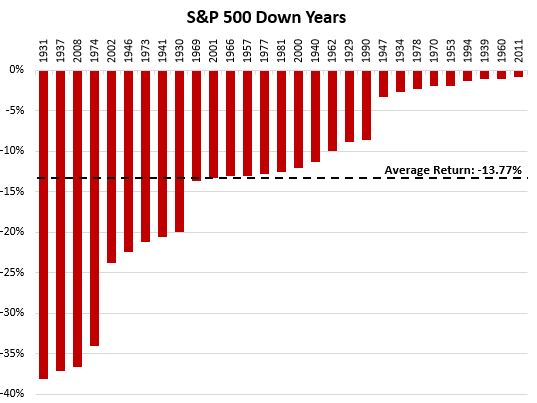
During these years when the S&P 500 experiences a negative return, the average return is -13.77%.
The worst return was -38.08% in 1931 and the least severe negative return was in 2011, with a -.87% inflation-adjusted return (Note that 2011 had a slight positive return before accounting for inflation).
Now, let’s take a look at each of the years when the S&P 500 experienced a negative return and see what type of return it experienced the following year:
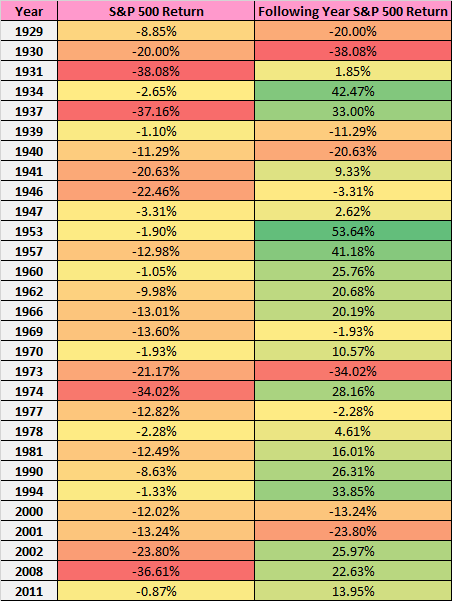
In 19 out of the 29 years when the S&P 500 experienced a negative return, it experienced a positive return in the following year.
If we create a scatterplot with the down year return on the x-axis and the following year return on the y-axis, here’s what it would look like:
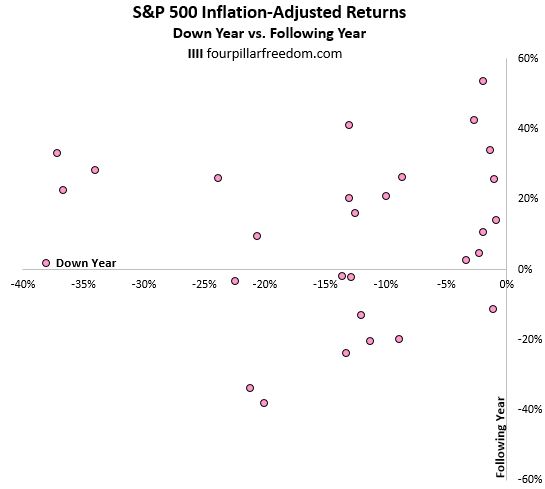
Each dot represents a down year/following year combination. For example, the dot highlighted below represents when the S&P 500 experienced a -20.00% return in 1930, then a -38.08% return during the following year in 1931:
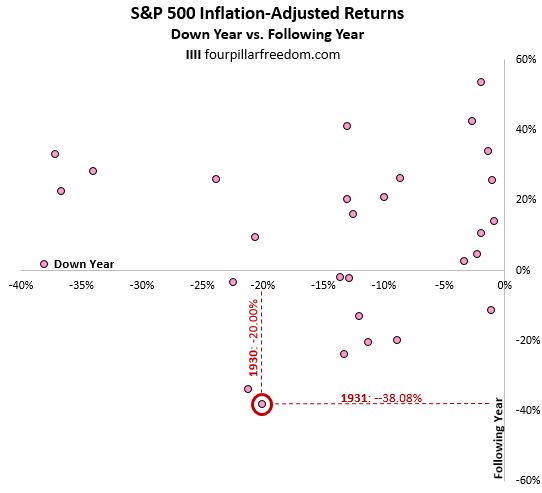
As we can see from the scatterplot, most of the dots lie above the x-axis since returns are typically positive during the following year after a down year.
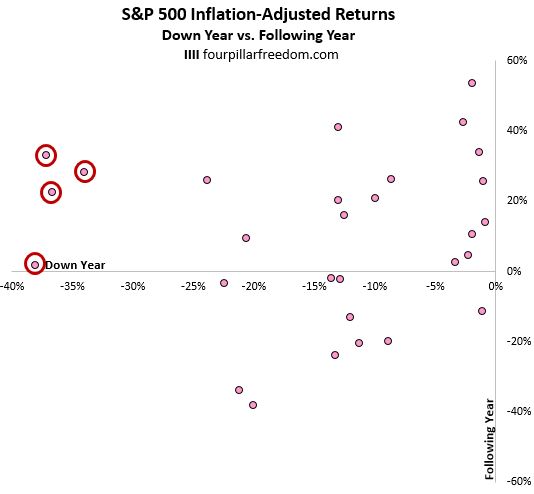
It’s also interesting to note that during the four times when the S&P 500 experienced a return of -30% or worse, the return during the following year was always positive, even after adjusting for inflation:
If we make a chart of the S&P 500 returns during the year following a down year, here’s what that would look like:
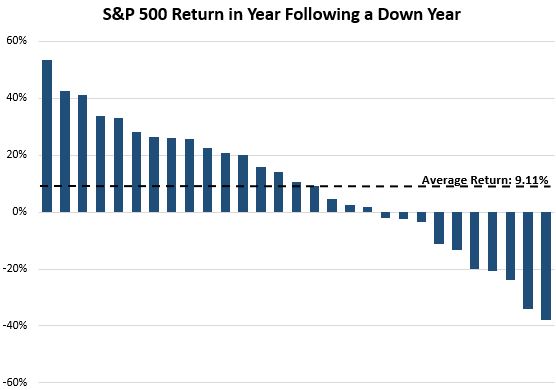
The average return in the year following a down year was 9.11%.
Now let’s extend our time horizon a bit and look at the 5-year annualized returns following a down year:
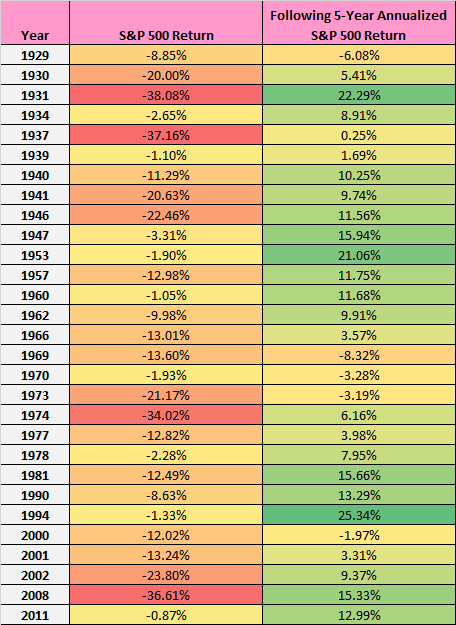
In 24 out of the 29 years when the S&P 500 experienced a negative return, it experienced a positive annualized return over the next five years, with an average annualized five-year return of 8.09%.
Conclusion
Here’s a summary of some of the interesting stats we learned in this post:
- Since 1928, the S&P 500 experienced negative returns in 29 different years.
- During these down years, the S&P 500 experienced an average return of -13.77%.
- In 19 out of the 29 years when the S&P 500 experienced a negative return, it experienced a positive return in the following year.
- The average return in the year following a down year was 9.11%.
- In 24 out of the 29 years when the S&P 500 experienced a negative return, it experienced a positive annualized return over the next five years.
- The average annualized five-year return following a down year was 8.09%.
- The Ad Revenue Grid - August 6, 2021
- Attract Money by Creating Value for a Specific Audience - July 13, 2021
- The 5-Hour Workday - March 26, 2021
Full Disclosure: Nothing on this site should ever be considered to be advice, research or an invitation to buy or sell any securities, please see my Terms & Conditions page for a full disclaimer.

Great article, love the analysis! As a data nerd myself, this is very cool!
Thanks B! Glad you enjoyed this analysis 🙂
Great read!
Thanks Dan!