6 min read
I recently read an article by economist Russ Roberts that challenged the common belief that the rich are getting richer in the U.S. while the middle class and the poor are stagnating.
In a nutshell, Roberts points out the many flaws in the studies that conclude that the rich are getting richer while everyone else is struggling to keep up. He also shares several studies that show how the poor and middle class have actually made substantial progress since the 1970s and how upward mobility is still alive and well in the United States.
Gloomy Studies on the Middle Class and the Poor
Roberts begins by sharing snippets from articles that claim that the rich are getting richer while everyone else is struggling to keep up.
From Thomas Piketty, Emmanuel Saez, and Gabriel Zucman:
“Looking first at income before taxes and transfers, income stagnated for bottom 50% earners: for this group, average pre-tax income was $16,000 in 1980 — expressed in 2014 dollars, using the national income deflator — and still is $16,200 in 2014.”
From New York Times columnist David Leonhardt:
“the very affluent, and only the very affluent, have received significant raises in recent decades.”
From Nobel Laureate Joseph Stiglitz:
“All the growth in recent decades — and more — has gone to those at the top.”
Based on these articles, it would seem that only the rich have benefited from the economic growth over the past few decades. Roberts explains in the following video why the data used in these articles is actually misleading:
In this video, Roberts points out the flaws in two different studies:
1. In one study, economist Paul Krugman concluded that average hourly wages for middle class workers dropped by 7% from 1973 to 2014, adjusting for inflation using the CPI-U (Consumer Price Index for Urban Consumers).
Roberts points out that if you instead adjust for inflation using the PCE (Personal Consumption Expenditures), which is a price index that the Federal Reserve uses that includes urban and rural consumers, and that measures housing and healthcare differently, you instead get a completely different result using the same data: average hourly wages for middle class workers actually increased by 17% from 1973 to 2014.
2. In another study, economist Jared Bernstein looked at the average household income for the middle 20% of households in the U.S. (excluding the bottom 40% and the top 40%), adjusting for inflation using the PCE, and concluded that average income for these households declined by 7% from 1979 to 2010.
Roberts points out that this analysis only looks at cash compensation, but leaves out benefits like health insurance, retirement contributions, childcare, vacation, life insurance, disability insurance, stock options, tuition reimbursement, gym access and fitness programs, meals, work cell phones, and work vehicles.
Also, it turns out that the proportion of people 65 or older in this middle 20% has nearly doubled over this time period, and most of these people don’t actually earn cash compensation from a job. Instead, most of their income comes from retirement savings and investments.
To accurately measure the change in income for this middle 20% from 1979 to 2010, Forbes writer Scott Winship analyzed the data using labor income (cash compensation + benefits) while excluding the elderly, and found that average household income actually increased by 23% even after inflation.
Roberts points out that a 23% increase in middle class household income from 1979 to 2010 is better than a decline of 7%, but this number still isn’t great. It turns out, though, that this 23% increase still doesn’t tell the whole story. To dig even deeper into the numbers, Roberts shares this video:
In this video, Roberts points out that since the divorce rate in the U.S. has been increasing and marriage rates have been decreasing over the decades, there are more single-earner households in the U.S.
In particular, divorce rates are highest among low-income households, which means a disproportionate percentage of low-income households only have one income-earner, which distorts the household income statistics.
How to Get an Accurate View of Income Growth
To account for demographic changes and get an accurate picture of income growth over the past few decades, we have to look at how individual incomes have changed over time. We need studies that follow the same people over time to see how their income changed. Fortunately, several of these studies exist and they have come to less gloomy conclusions.
From Roberts:
“Studies that use panel data — data that is generated from following the same people over time — consistently find that the largest gains over time accrue to the poorest workers and that the richest workers get very little of the gains. This is true in survey data. It is true in data gathered from tax returns.”
He goes on to share several examples of studies that use panel data along with the findings from these studies:
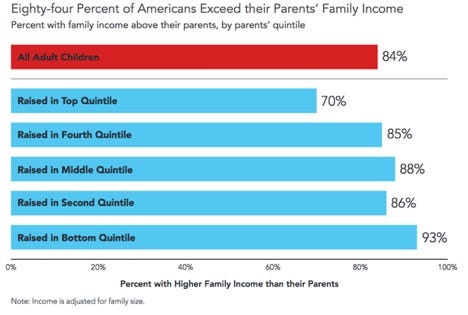
“This first study, from the Pew Charitable Trusts…compares the family incomes of children to the income of their parents. Parents income is taken from a series of years in the 1960s. Children’s income is taken from a series of years in the early 2000s. As shown in Figure 1, 84% earned more than their parents, corrected for inflation. But 93% of the children in the poorest households, the bottom 20% surpassed their parents. Only 70% of those raised in the top quintile exceeded their parent’s income.”

Roberts shares another study:
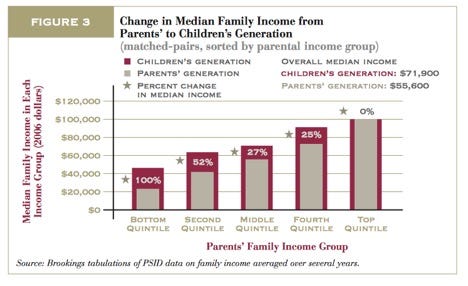
“Julia Isaacs’s study for the Pew Charitable Trusts finds that children raised in the poorest families made the largest gains as adults relative to children born into richer families.”

“The children from the poorest families ended up twice as well-off as their parents when they became adults. The children from the poorest families had the largest absolute gains as well. Children raised in the top quintile did no better or worse than their parents once those children became adults.”
Roberts points out that the findings from this study are in stark contrast to the common belief that only the rich have benefited from economic growth since the 1970s:
“The children from the poorest families added more to their income than children from the richest families. That reality isn’t consistent with the standard pessimistic story that only the richest Americans have benefited from economic growth over the last 30–40 years. Or that only the richest Americans have gotten raises.
The pessimistic story based on comparing snapshots of the economy at two different points in time misses the underlying dynamism of the American economy and does not accurately measure how workers at different places in the income distribution are doing over time.”
Roberts shares another study:
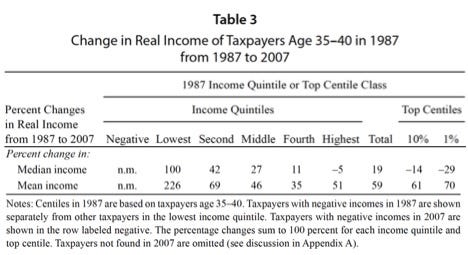
“Gerald Auten, Geoffrey Gee, and Nicholas Turner of the Office of Tax Analysis in the Treasury Department used tax returns to see how rich and poor did between 1987 and 2007. They find the same encouraging pattern: poorer people had the largest percentage gains in income over time:”

“The study looks at people who were 35–40 in 1987 and then looks at how they were doing 20 years later, when they are 55–60. The median income of the people in the top 20% in 1987 ended up 5% lower twenty years later. The people in the middle 20% ended up with median income that was 27% higher. And if you started in the bottom 20%, your income doubled. If you were in the top 1% in 1987, 20 years later, median income was 29% lower.”
Conclusion
Roberts wraps up the article by stating that although the U.S. economy isn’t perfect and that studies on income growth are inherently dependent on many assumptions, the actual income growth of the middle class and the poor since the 1970s has been much higher than many doom-and-gloom articles make it appear:
“There’s a lot more to study and understand. But what the studies above show is that the economic growth of the last 30–40 years has been shared much more widely than is generally found in the cross-section studies that compare snapshots at two different times, following quintiles rather than people.
No one of these studies is decisive. They each make different assumptions about income (see the footnotes below), which people to include, how to handle inflation. Together they suggest the glass isn’t as empty as we’ve been led to believe. It’s at least half-full.
This does not mean that everything is fine in the American economy. There are special privileges reserved for the rich that help them reduce their risk of downward mobility — financial bailouts are the most egregious example. There are too many barriers like occupational licensing and the minimum wage that handicap the disadvantaged desperately trying to succeed in the workplace. And the American public school system is an utter failure for too many children who need to acquire the skills needed for the 21stcentury.
But the glass is at least half-full. If we want to give all Americans a chance to thrive, we should understand that the standard story is more complicated than we’ve been hearing. Economic growth doesn’t just help the richest Americans.”
- The Ad Revenue Grid - August 6, 2021
- Attract Money by Creating Value for a Specific Audience - July 13, 2021
- The 5-Hour Workday - March 26, 2021
Full Disclosure: Nothing on this site should ever be considered to be advice, research or an invitation to buy or sell any securities, please see my Terms & Conditions page for a full disclaimer.

I wonder if the issue here is the difference between perception and reality. More specifically is it that the Middle Classes don’t feel like they are better off? I saw a study looking at GDP and happiness. What that suggested was that happiness was related to the rate of increase in GDP, not it’s absolute level.
If you take that to a micro level that would suggest that someone whose income has risen from say $10,000 to $60,000 over five years will be happier than someone whose income has gone from $55,000 to $60,000 even though the have less money overall.
Does the stagnation narrative arise because middle class incomes are not rising as fast as the middle classes believe they should – not because they are actually stagnating?
You bring up some interesting points. I don’t have research or data to back up your statements, but I imagine that they’d be true to an extent. People compare themselves to their neighbors, not their ancestors, so they’re often unhappy if their income is rising at a slower pace than those around them, even if their income is increasing in absolute real terms.
Zach, this is a great compilation of this data! I feel inundated daily by facebook posts about how bad it is, but when I look at it critically I feel like we are doing better. I’ve taken some stats & research classes (I know you have too!) and one of the first things we learn is “figures can lie and liars can figure”! I really believe the emotional bearing the “doom & gloom” articles pain gets people riled up to march instead of go to work. I do agree that it’s not perfectly level for everyone, but the opportunity IS there for most! Well-written article!
dan
Thanks Dan! I’m glad you found this analysis so useful! And I agree, it’s easy to twist the numbers to tell a certain story.