
4 min read
Here is a graph of the S&P 500 price since 1970:
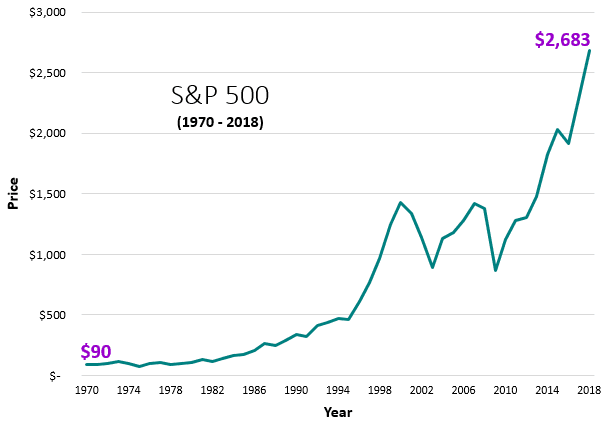
At the start of 1970, the S&P 500 was sitting at $90. By the start of 2018, it had risen to $2,683.
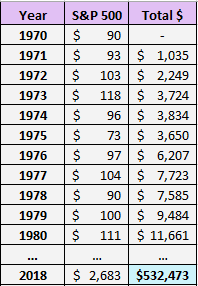
If you invested $1,000 every year from 1970 through 2017, you would have accumulated $532,473 (this doesn’t account for dividends).
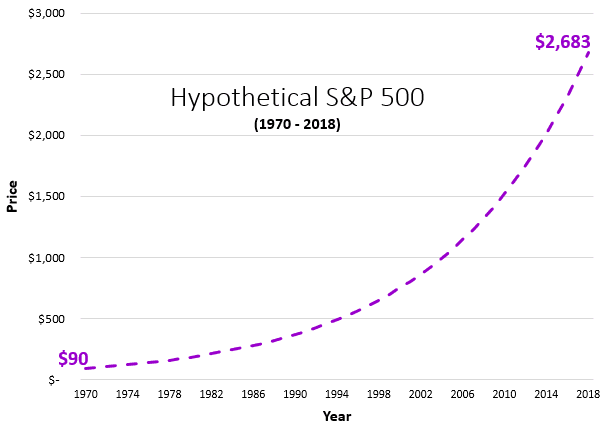
Now, imagine the price of the S&P 500 had the exact same starting and ending prices during this time period, but had the same consistent 7.3% returns each year, with no market crashes:
In this scenario, if you invested $1,000 every year, you only would have accumulated $420,846 (this doesn’t account for dividends).
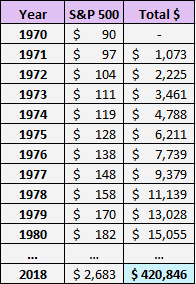
That’s a difference of $111,627.
The reason for this massive difference comes from the prices you’re buying at. In the actual return scenario, you were able to buy at lower prices during the drops, which leads to increased investment returns:
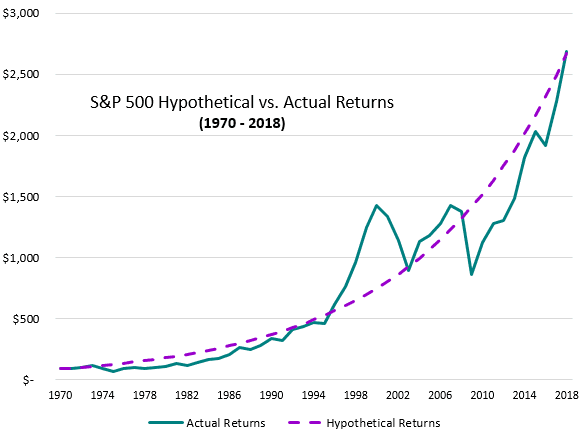
In particular, the market drops offered the best possible times to invest. These drops allowed you to invest at cheaper prices and experience significantly higher returns on investments over time compared to the hypothetical path.
To illustrate the math behind this, consider this simple example:
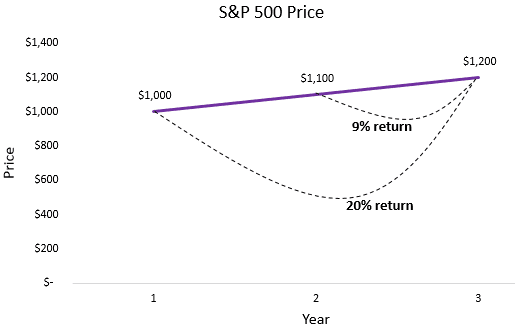
Scenario 1 (No Market Drop) : Suppose the S&P 500 starts at $1,000. After one year it increases to $1,100. One year later it increases to $1,200:
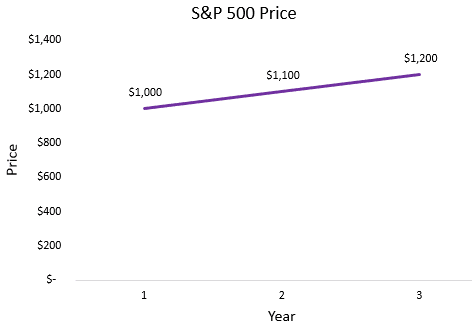
The money you invest in year 1 experiences a 20% (1200 – 1000 / 1000) total return by year 3.
The money you invest in year 2 experiences a 9% (1200-1100 / 1100) total return by year 3.
Scenario 2 (Market Drop) : Again, suppose the S&P 500 starts at $1,000. But this time, after one year it drops to $900. Then one year later it increases to $1,200:
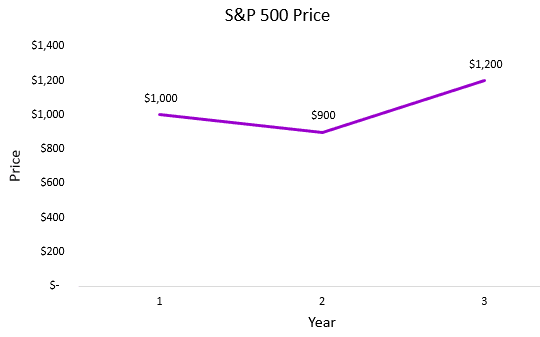
The money you invest in year 1 experiences a 20% (1200 – 1000 / 1000) total return by year 3. (same as before)
But in this scenario, the money you invest in year 2 experiences a 33% (1200-900 / 900) total return by year 3. (compared to a 9% return in previous scenario)
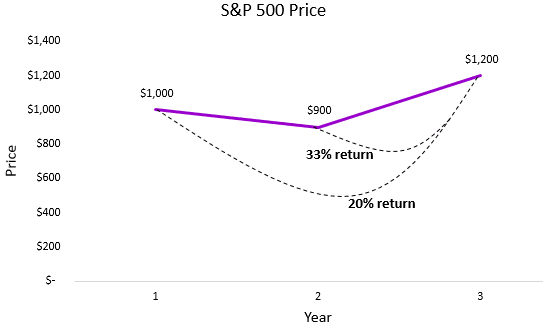
The money you invest in year 2 has an incredible 33% total return, which crushes the return in the previous scenario. The market drop here is an opportunity for an investor to buy the S&P 500 at a cheaper price. As long as the price recovers over time, this investor will have higher returns than the investor in the previous scenario.
Why This is Important
For investors with long time horizons, market drops should be welcomed. The whole idea is that you want to invest your money at cheap prices that will appreciate over time. If the market only went up in a consistent fashion each year, you would be buying at higher and higher prices. Conversely, when the market drops, it offers a chance for you to buy at cheaper prices and experience higher returns over time once the market recovers.
For investors who dollar-cost average over time, they’ll experience much higher returns on their investments if they’re able to invest during market drops.
In particular, young investors should be hoping for a drop since they have the longest investment time horizons. In the short term it represents a loss, but over the course of decades it leads to higher returns.
- The Ad Revenue Grid - August 6, 2021
- Attract Money by Creating Value for a Specific Audience - July 13, 2021
- The 5-Hour Workday - March 26, 2021
Full Disclosure: Nothing on this site should ever be considered to be advice, research or an invitation to buy or sell any securities, please see my Terms & Conditions page for a full disclaimer.

As always, nice graphs – very helpful, Zach.
Mrs. BD and I are both 33, so we have a long-term horizon for our retirement accounts. While I want the current bull market to continue as long as possible, we’re currently allocating new 401(k) contributions to a short-term bond fund to build up some cash-like holdings. We also cut back out retirement contributions, in general, to focus on taxable account growth.
We’ll see what happens this year.
Great job explaining all of that. Even though I understand it, before reading this I wouldn’t have been able to explain it so well.
Sorry to say, but this calculation is based on a wrong assumption Zach. What you did is to divide the difference of S&P 2018 compared to S&P 1970 by 48 years (roughly 54 points a year) and plotted it in a linear way. This means you have a very high growth in the beginning 1970 (44% in first year) but very low growth in the end 2018 (2%). This is why those growth diagrams should always be pictured in a logarithmic way. A linear curve as you used it this case is in fact an negative expontional growth curve. For this growth related stuff you need to draw a linear line in a logarithmic graph, then you will see an average yearly growth of 7,3% throughout this 48 year phase and then you will not have that big difference between the real result and the result in case of an average yearly growth of 7,3 %.
As I am not a native speaker I hope my point is understandable 😉
Anyhow great blog, I really like to read your posts.
Hey Lejero,
Thank you for pointing that out…that’s an embarrassing mistake on my part. I just went ahead and corrected all the charts and graphs to reflect the actual 7.3% annual growth path. It’s interesting to see that the same conclusions hold – the actual returns still beat the hypothetical consistent returns, but not as much as before obviously haha.
Thanks for double checking my work!
Hi Zach,
thanks for the update, it is interesting that there is still such a big difference. What I would have expected is, that the average growth should in the long run be similar to the real world growth. I think there might be two reasons why it is not: 1. most of the time the real growth is below the average growth and the big steps up will be done in relatively short time periods. 2. the current evaluation of the S&P is much to high, e.g. with a average growth rate of 6% the Hypothetical and Actual Results might be the same (didn’t calculate it) and the S&P today would be round about 1475 points.
Conclusion from 1 would be: don’t try to time markets and hold your stocks, cause the chance is high to miss those short time periods where the market is doing the big steps.
Conclusion from 2: where is the Exit… 😉
Anyhow, like you I am a buy-continuously-and-hold-guy, I only sell (a part) when there is a great opportunity in another asset class opening up and not because I think a market is overevaluated.
Thanks again for your great blog that makes me think about new points of view.
Couldn’t agree more with those points. It is pretty incredible to realize how most market gains take place in such a small period of time, which as you said, makes timing the market incredibly difficult. This explains why a “buy and hold” strategy generally outperforms over the long run. I personally make all my investments with the thought that I’ll basically hold each stock/REIT/whatever else forever unless I see a strong reason to sell.
Thanks for the kind words 🙂