Question: How much would you need to save every day in order to have one million dollars?
Answer: Depends on your timeline.
(the following examples assume a 5% annual interest rate)
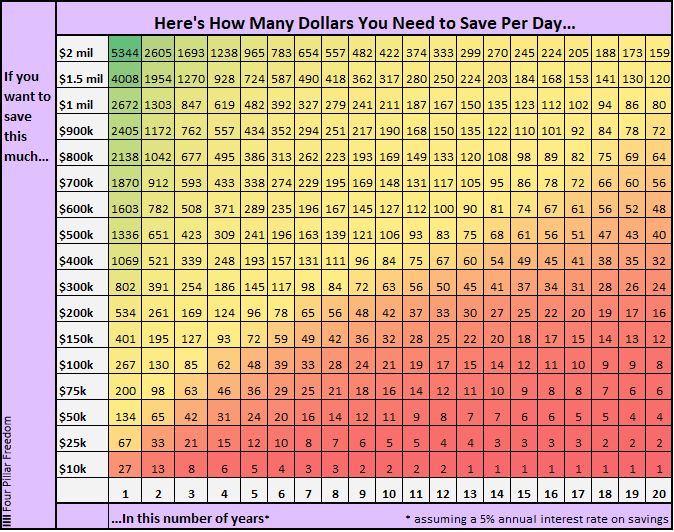
If you want to save a million bucks in ten years you would need to save $211 every day. But if you give yourself twenty years you would only need to save $80 per day.
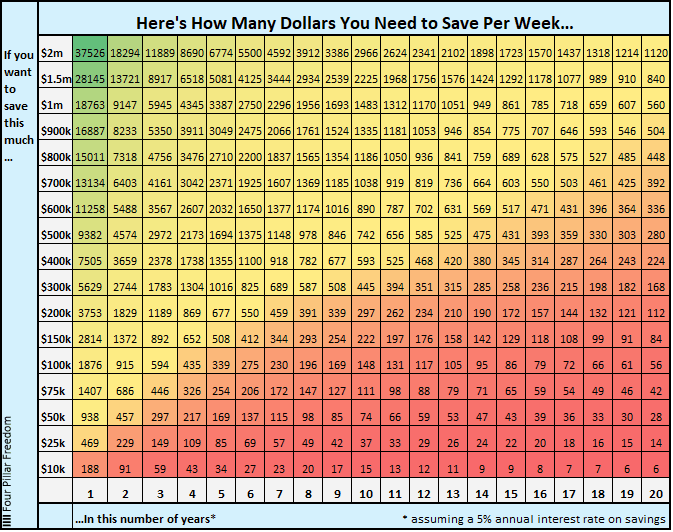
Or maybe it’s easier to think about saving money in terms of weeks. If you want to save a million bucks in ten years you would need to save $1,483 per week. If you give yourself twenty years you would need to save $560 per week.
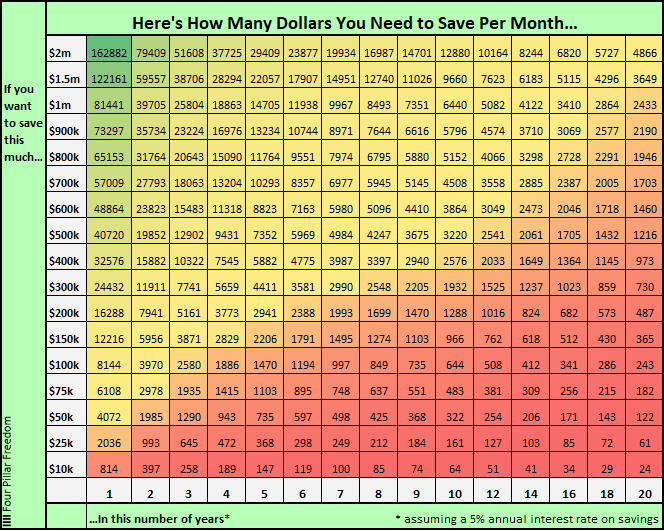
Or maybe you prefer to think of savings in terms of months. To save a million bucks in ten years you would need to save $6,440 per month. If you give yourself twenty years you would need to save $2,433 per month.
But what if your goal isn’t $1 million? What if it’s $2 million? Or only half a million? Or maybe just $10,000?
Fortunately for you, the following three charts show how much you need to save each day, each week, or each month to reach your savings goals.
All three grids assume you are starting from $0 and that your savings grow at an annual interest rate of 5%. All numbers in the grids are rounded to the nearest dollar.
The Daily Savings Grid

The Weekly Savings Grid

The Monthly Savings Grid

Some Interesting Observations
- To save half a million dollars in 10 years or less you need to save at least $100 per day.
- You can save $1 million dollars in 20 years by saving $560 per week.
- You can save $100k in 7 years by saving about $1,000 per month.
- A 22 year-old college grad can have half a million dollars saved by age 42 by saving $280 per week.
- The Ad Revenue Grid - August 6, 2021
- Attract Money by Creating Value for a Specific Audience - July 13, 2021
- The 5-Hour Workday - March 26, 2021
Full Disclosure: Nothing on this site should ever be considered to be advice, research or an invitation to buy or sell any securities, please see my Terms & Conditions page for a full disclaimer.

Interesting numbers and helpful to see the various time perspectives.
Just curious – what application did you use to create the grids? Excel or Sheets (or something else)? I also enjoy using conditional formatting for visual trending.
I used Excel to create the grids. The conditional formatting is also one of my favorite features, I think it helps highlight the differences between the numbers nicely.