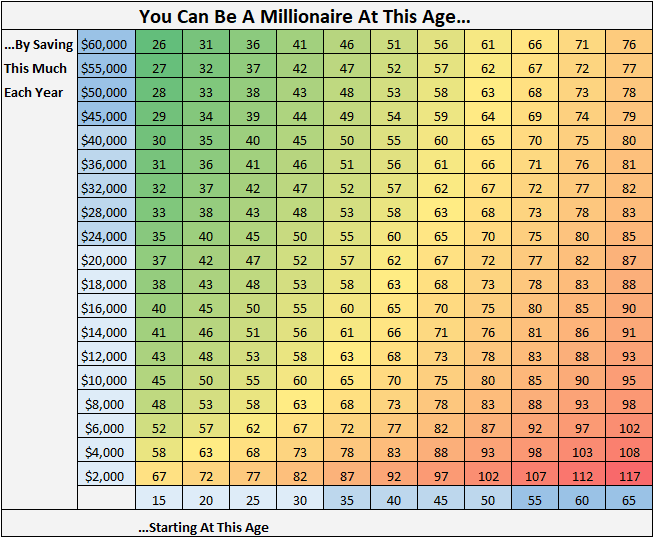
This grid shows at what age you can become a millionaire, based on your yearly savings and what age you start saving. This grid assumes you start with $0 and your savings are invested at a 7% annual interest rate.
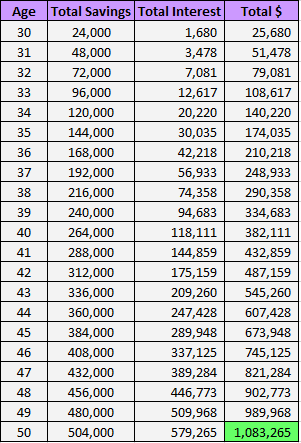
For example: If you start saving $24,000 every year starting at age 30, you will have one million dollars by time you are 50.
Here’s the math behind that:

Some Interesting Observations
- No matter what age you start, by saving $10,000 per year you can become a millionaire in 30 years
- No matter what age you start, by saving $20,000 per year you can become a millionaire in 22 years
- No matter what age you start, by saving $40,000 per year you can become a millionaire in 15 years
- A 50 year old with a net worth of $0 can become a millionaire by 63 through saving $50,000 per year. This might seem unreasonable, but keep in mind this is the age where most people are near their peak earnings.
- Anyone can become a millionaire before the traditional retirement age of 65 by saving only $4,000 per year starting at age 20.
Latest posts by Zach (see all)
- The Ad Revenue Grid - August 6, 2021
- Attract Money by Creating Value for a Specific Audience - July 13, 2021
- The 5-Hour Workday - March 26, 2021
Full Disclosure: Nothing on this site should ever be considered to be advice, research or an invitation to buy or sell any securities, please see my Terms & Conditions page for a full disclaimer.

That’s very interesting, and
my experience bears it out. Saving what I did the chart hits almost to the year my first million in investments. It shows that normal people with a little abnormal discipline can’t avoid becoming millionaires.
That’s awesome to hear you can confirm the numbers for the chart through your own experience! And I agree with you – discipline is the one trait that can allow anyone to become a millionaire given enough time.
Hi interesting chart you got here, i am trying to work out a similar chart where i can tweak the annual rate of return.
Understand your chart were calculated based on compounding effect, but any reason you are deducting the interest earned in the previous year in the total $ column?
i.e. as at the end of 2 years , i would have (25680+24000)*1.07=$53158, but yours calculated were $51478 (deducting the interest earned in previous year). Is there any particular reason?
AHAN, that’s a great point. Now that I’m running the numbers again in Excel I see that you’re correct. I’m not sure why the interest from the prior year was being subtracted. Fortunately the numbers for the interest are small enough that the grid essentially has all the correct numbers in it still. Thanks for pointing that out!
Where are you getting a 7% interest rate? If that were available, we’d all be saving.
A diversified portfolio of stocks has had historical returns of roughly 7% per year. In this grid, I assume that your savings are invested in equities, not just sitting in a savings account earning 1% or less in interest annually. Thanks for the question! 🙂
I’d love to see a grid where you can add
1. Current investments. (this chart assumes starting at 0)
2. See what that million will give you with a SWR of 4% adusted for inflation
Hey Kenneth, you may want to check out this F.I. calculator I built that lets you adjust starting amount, rate of return, and withdrawal rate: https://fourpillarfreedom.com/four-visuals-volume-1-financial-independence-calculator/