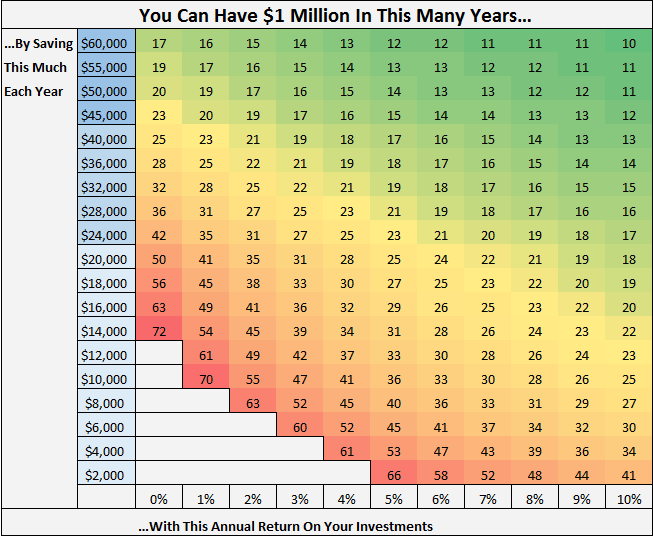
Behold. The million dollar grid.
This grid shows how many years it will take you to save $1 million based on how much you save each year and your annual return on your investments.
The grid assumes you are starting at $0.
An Example Using the Grid
Here’s an example of the math behind the grid. If you save $20,000 per year and invest these savings at a 5% interest rate, you can be a millionaire in 25 years:

Some Interesting Observations
- Starting with $0, you can become a millionaire in 30 years by saving $1,000 per month and investing it at a 5% annual interest rate.
- You can also become a millionaire in 30 years by saving only $500 per month (so $6,000 per year) and investing it at a 10% annual interest rate.
- The more you save, the less investing returns influence how many years it will take to become a millionaire. For example, by saving $50,000 per year and earning 5% annual returns, you’ll be a millionaire in 14 years. By increasing your annual investment returns to 10%, you’ll only become a millionaire 3 years sooner…
- …The opposite is also true. The less you save, the more influential investing returns become. By saving just $2,000 per year with 5% returns, it will take you 66 years to become a millionaire. But by saving that same amount with 10% returns, you can become a millionaire in only 41 years.
- Even with pitiful 2% annual returns, you can become a millionaire in just over 30 years by saving $2,000 per month (so $24,000 per year).
Latest posts by Zach (see all)
- The Ad Revenue Grid - August 6, 2021
- Attract Money by Creating Value for a Specific Audience - July 13, 2021
- The 5-Hour Workday - March 26, 2021
Full Disclosure: Nothing on this site should ever be considered to be advice, research or an invitation to buy or sell any securities, please see my Terms & Conditions page for a full disclaimer.

Thanks for the resource! It’s tough to see your ideal retirement time, since it also depends on your level of expenses, too.
That’s true! This grid is simply how long it takes to become a millionaire, regardless of your level of expenses. So it’s only looking at income 🙂
I love your graphs! This one is no exception… thank you for sharing!
Thanks Mrs. Adventure Rich 🙂
Thanks Mrs. Adventure Rich 🙂
Zach, your graphs are awesome! Could you please provide this same graph but the y axis extended so that it goes all the way up to 200k/year? (If this wouldn’t be too time consuming on your part of course). I figure that kind of aggressive savings is possible for individuals with high salaries (or, more likely, couples with high salaries).
Thanks in advance!
Sure thing Angela! I’ll email you 🙂