
7 min read
The most popular formula people use to determine how much they need to save for retirement is known as the 4% Rule, which was popularized by the Trinity Study, a retirement study published in 1998 by three professors from Trinity University in Texas.
The study found that a retirement portfolio of 50% large-cap stocks and 50% long-term high-grade corporate bonds survived 95% of all 30-year periods from 1926 to 1995 assuming 4% (inflation-adjusted) of the total portfolio was withdrawn at the start of each year.
Based on this rule, if you save up 25 times your annual retirement spending then there is a high likelihood that you won’t deplete your portfolio in retirement, assuming you withdraw the inflation-adjusted equivalent of 4% of the starting portfolio value each year in retirement.
For example, if you plan on spending $40k each year in retirement, your portfolio needs to be worth $40k * 25 = $1 million so you can withdraw 4% of it ($40k) each year.
If you only plan on spending $30k each year in retirement, your portfolio only needs to be worth $30k * 25 = $750k before you can retire.
While this rule gives you a rough idea of how much you need to save before retiring, it’s a bit simplistic. What if you retire right before a recession? Or what if you expect to receive a pension or Social Security in retirement? Or what if you invest conservatively and hold more bonds in your portfolio?
To incorporate these nuances, it’s helpful to use a retirement calculator like FIRECalc that can handle all of these tiny details.
In this post, I’ll share why I like FIRECalc so much along with how you can use it yourself to determine how much you need to save for retirement.
An Intro to FIRECalc
FIRECalc, as described on its site, is “a different kind of retirement calculator.”
Unlike other calculators, FIRECalc doesn’t tell you how much you need to save for retirement. Rather, it tells you how a hypothetical retirement portfolio would have performed during every period since 1871, based on:
- Your starting portfolio value
- Your estimated yearly spending in retirement
- Your retirement length (in years)
In this sense, FIRECalc is more of a simulator than a calculator.
The example that FIRECalc uses on its homepage illustrates why simulations can be so helpful: Consider three people that retire in 1973, 1974, and 1975. Each person has $750,000 in their portfolio and withdraws $35,000 per year. Each portfolio is composed of a 75% stock index fund and a 25% bond index fund.
The following chart shows how each portfolio would have performed over time, starting in 1973 (red), 1974 (blue), and 1975 (green).
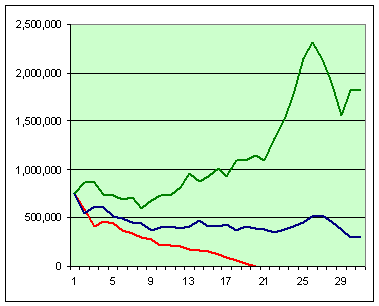
All three portfolios performed wildly different, despite all of them starting in the early 1970s. This is the cool thing about FIRECalc: It shows you how your portfolio would have performed during every period since 1871.
FIRECalc explains the benefit of this simulation approach:
“You can get a sense of just how safe or risky your retirement plan is, based on how it would have withstood every market condition we have ever faced.”
How To Use FIRECalc
The simplest way to use FIRECalc is to fill in the three values for annual retirement spending, portfolio value, and retirement length (in years) on the homepage, then click “Submit.”
For example, I’ll enter $40,000 as the annual retirement spending, $1,000,000 as the starting portfolio value, and 30 years as the retirement period:
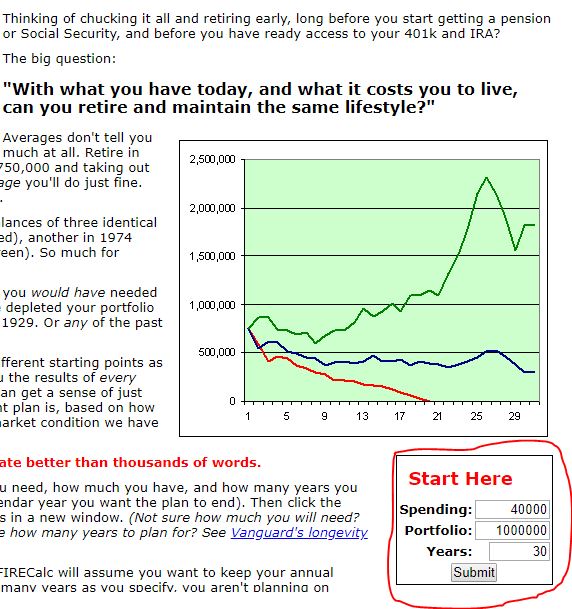
FIRECalc then outputs the following chart:
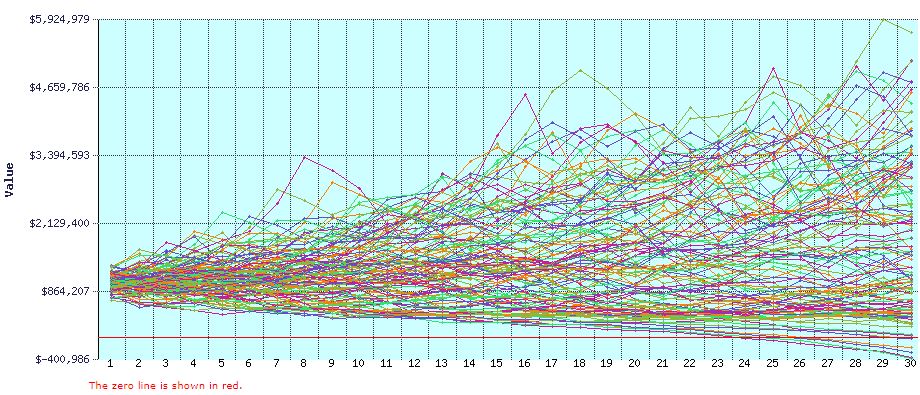
Each individual line on the chart shows how a portfolio with a starting value of $1,000,000 and yearly withdrawals of $40,000 (inflation-adjusted) would have performed during every 30-year period since 1871.
FIRECalc then tells me that this portfolio would have ended with a positive value in 113 out of 119 possible 30-year periods, which is roughly a 95% “success rate.”
It also tells me that the following information:
- The average ending portfolio value was $1,867,416
- The lowest ending value was $0
- The highest ending value was $5,679,475
This illustrates just how much your portfolio value can fluctuate depending on when you retire.
Keep in mind FIRECalc uses the following assumptions:
- Your annual spending each year in retirement will be the same, adjusting for inflation each year.
- You won’t receive any Social Security or pension.
- Your portfolio is invested in a “couch potato” portfolio of 75% stock index and 25% bond funds, with a 0.18% annual fee on the total portfolio.
Also keep in mind that FIRECalc considers a portfolio to be “successful” if it isn’t completely depleted by the end of the retirement period.
This means a portfolio with just $1 left in it at the end of 30 years would be considered successful. While this might be mathematically true, someone in their 90s with just $1 left in their portfolio probably wouldn’t feel too comfortable. So, keep this in mind when you view the “success rate” of a portfolio.
Fortunately, FIRECalc gives you the ability to change all of the default settings, including your estimated Social Security and pension in retirement, your portfolio allocation, your estimated changes in spending over time, any expected lump sum changes to your portfolio, and much more.
You can make all of these changes using the different tabs along the top of the site:
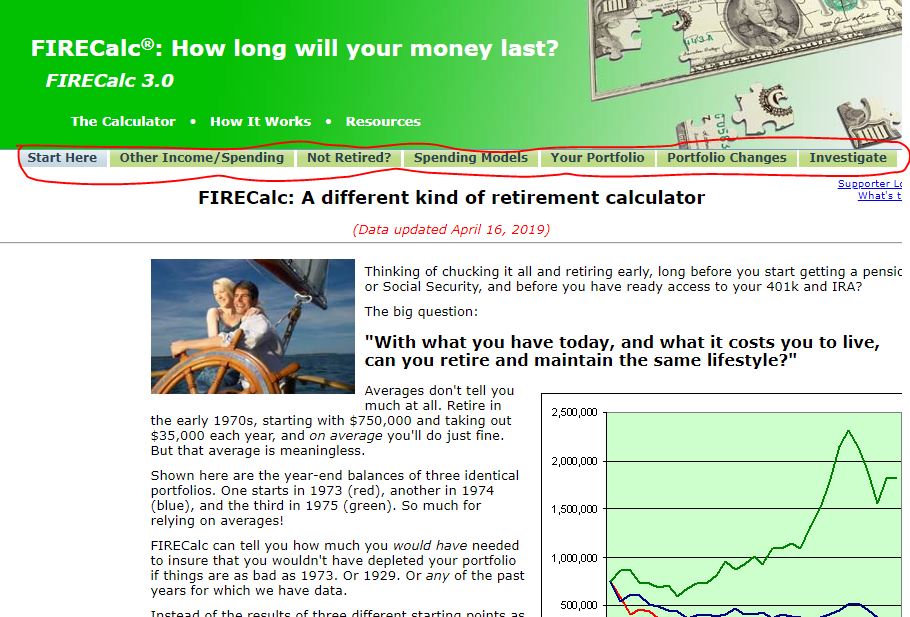
Let’s check out how changing some of the defaults might impact a portfolio’s success rate.
Other Income/Spending
The first tab titled Other Income/Spending allows you to add estimated social security payments for both you and your spouse starting in a specified year along with estimated pensions starting in specified years.
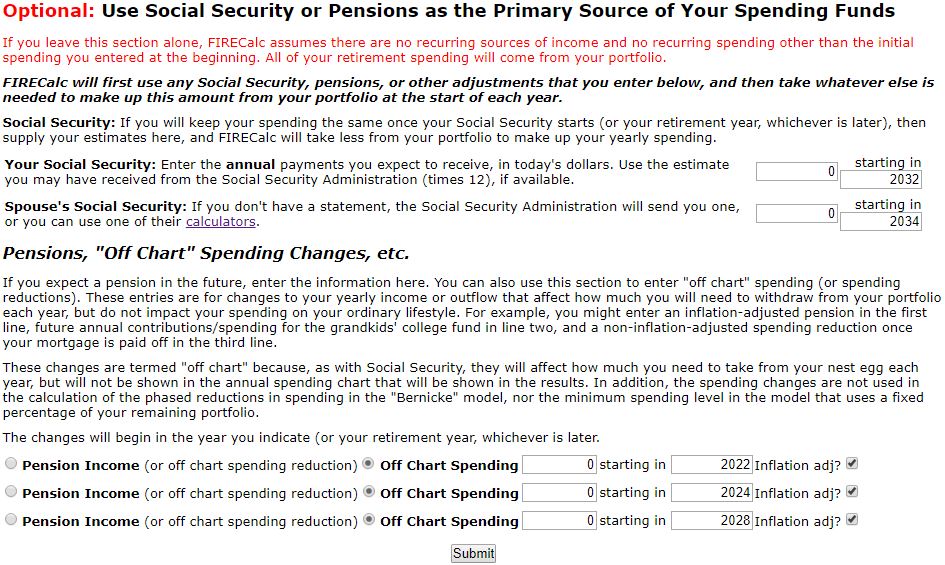
If you’re not sure how much you can expect to receive from Social Security, there is a helpful link to a Social Security Administration page where you can estimate your annual retirement benefits.
I’ll leave these numbers blank, but feel free to play around with different estimated amounts to see how a pension or Social Security could impact your portfolio performance.
Not Retired?
The next tab titled Not Retired? allows you to specify the year in which you plan on retiring along with how much you plan to contribute to your portfolio each year leading up to your retirement.
Keep in mind that if you modify the numbers on this tab, you may need to modify the numbers on the front page. For example, suppose I want to retire in 20 years and I plan on adding $10,000 to my portfolio each year from now until retirement.
In that case, I would go back to the front page of the site and change my portfolio value to reflect my current portfolio value of $120,000 and also change the “years” value to 50 to reflect the fact that I want to analyze how my portfolio will perform over both the next 20 years and the 30-year retirement period that follows.
Once I make these changes, I can click “Submit” and view the results of the simulations:
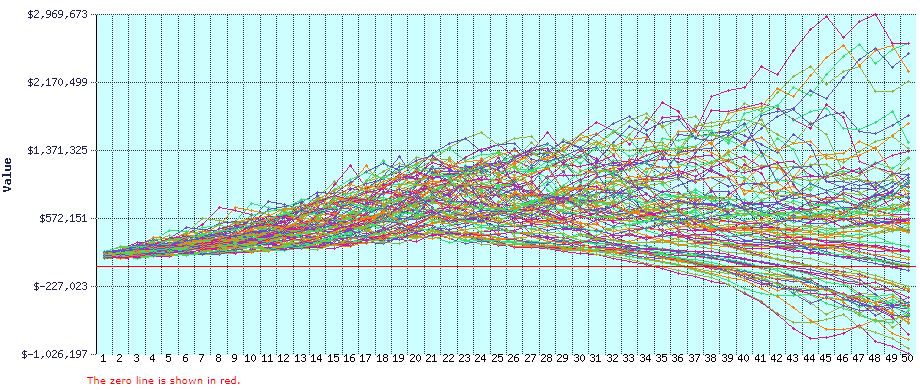
FIRECalc tells me that based on the numbers I provided, my portfolio would have experienced just a 66.7% success rate during all historical 30-year periods.
Spending Models
The next tab titled Spending Models allows you to specify how much you’ll spend each year in retirement.
By default, FIRECalc assumes that you’ll spend the same amount each year, adjusted for inflation. However, you can change the way that the simulator calculates inflation and you can modify how much you’ll spend each year based on two different methods:
Bernicke’s Reality Retirement Plan: “Ty Bernicke’s Reality Retirement Planning: A New Paradigm for an Old Science describes extensive research showing that most people see significant reductions in spending with age (not related to reduced assets or income). If selected, this option will reduce your inflation-adjusted yearly spending by 2-3% per year starting at age 56, and then stabilizing at age 76 to keep up with inflation. You should read his article for details if you plan to use this option.”
Percentage of Remaining Portfolio: “Adjust your spending depending on the value of your portfolio each year, spending the same percentage of your remaining portfolio in future years as you are spending the first year. You can soften the impact of large drops in your portfolio by setting a minimum spending in any year to no less than a certain percentage of the previous year’s spending.”
I prefer to use the constant spending model, so I won’t modify these settings.
Your Portoflio
The next tab titled Your Portfolio allows you to specify your portfolio allocation along with the percentage you pay in fees.
By default, FIRECalc assumes you’re invested in a 75% stock index fund and a 25% bond index fund and that you pay 0.18% in fees. However, you can modify these default settings.
You can specify a more complex allocation that includes U.S. micro-cap stocks, U.S. small-cap stocks, U.S. small-cap value stocks, S&P 500, U.S. large-cap value stocks, U.S. long-term treasuries, U.S. long-term corporate bonds, and U.S. 1-month treasuries.
You can also specify a portfolio that earns consistent yearly growth (although this isn’t very realistic) and a portfolio with random performance.
Out of curiosity, I decided to change my portfolio to a 100% stock index fund allocation to see how this impacted performance:
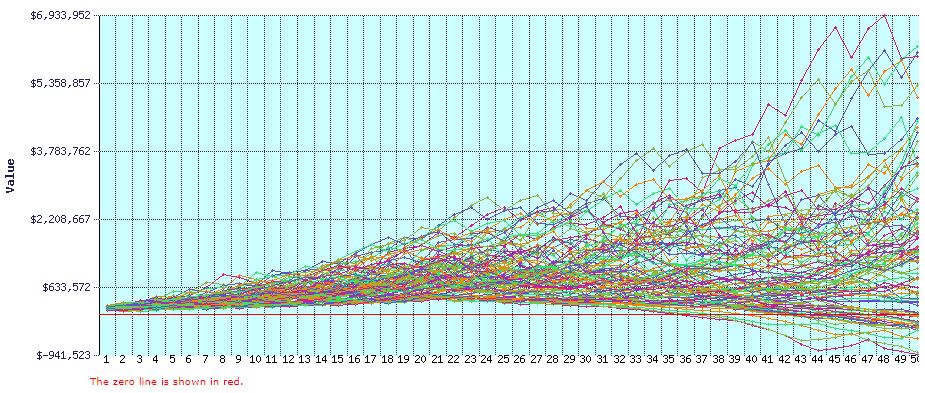
Making this change caused my success rate to jump from 66.7% to 77.8%.
Next, I changed the fee percentage from 0.18% to 0.03%, which is what you currently pay for the lowest-priced Vanguard stock index funds.
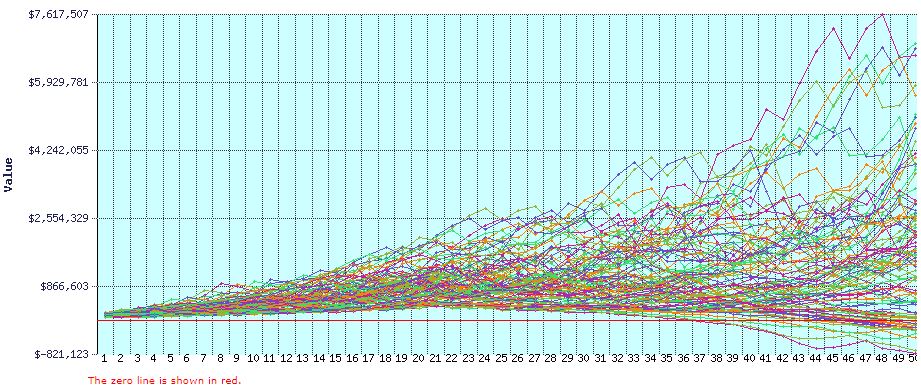
This caused the success rate to go from 77.8% to 82.8%. That’s a meaningful difference for making such a seemingly small change. This illustrates the importance of keeping investment fees low!
Portfolio Changes
The next tab titled Portfolio Changes allows you to specify a lump-sum change that you expect to impact your portfolio in a certain year.
The example FIRECalc provides is a home sale: “Chances are, you’ll move out of that big house in the expensive area, and get a tidy lump sum to add to your portfolio. Later, you’ll perhaps take out cash to buy your retirement home. Enter one-time changes here.”
I’ll leave this section empty, but feel free to add any lump-sum changes you personally expect to experience in the future.
Investigate
The last tab titled Investigate allows you to “investigate” the following changes to your retirement plan:
- Changes to allocation
- Changes to fees paid
- Changes in delaying retirement
- Search for changes that lead to a specific success rate
- Change the minimum amount needed at the end of a period for a portfolio to be considered a “success”
Each of these are interesting to investigate to gain a better understanding of how asset allocation, fees, and other variables impact your retirement plan.
Try FIRECalc
Determining how much you need to save for retirement can be a complex process, but fortunately FIRECalc accommodates this inherent complexity and allows you to gain a better understanding of how your retirement portfolio would have performed in historical scenarios.
Although FIRECalc can’t predict how the market will perform in the future (nobody can!) it can give you an idea of how certain portfolios performed in the past, which can give you some insight into how certain portfolios may perform in the future.
- The Ad Revenue Grid - August 6, 2021
- Attract Money by Creating Value for a Specific Audience - July 13, 2021
- The 5-Hour Workday - March 26, 2021
Full Disclosure: Nothing on this site should ever be considered to be advice, research or an invitation to buy or sell any securities, please see my Terms & Conditions page for a full disclaimer.
