4 min read
IPUMS CPS is a database that contains information on demographic and employment numbers for every U.S. state.
One particularly interesting table in this database contains the income percentiles for both individuals and households in every U.S. state. I thought it would be neat to download and visualize some of this data.
Note: Income is based on 2017 annual incomes since this is the most recent data available.
Visualizing Individual Incomes in Every U.S. State
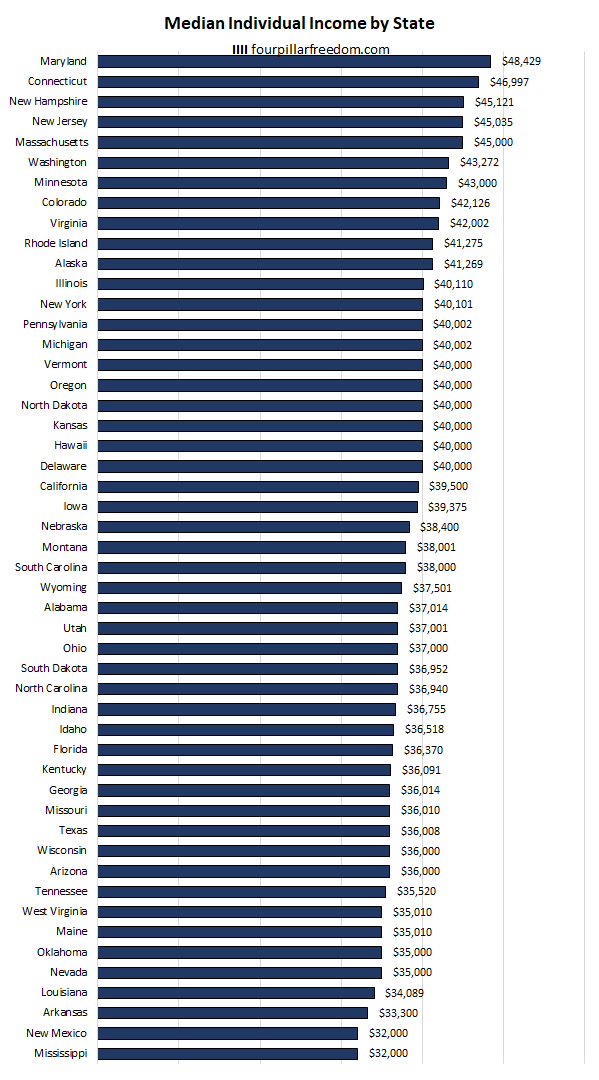
The following chart shows the median annual income for individuals in each U.S. state:

Maryland leads the way with a median annual income of $48,429 for individuals while Mississippi and New Mexico bring up the bottom of the list with median annual incomes of just $32,000.
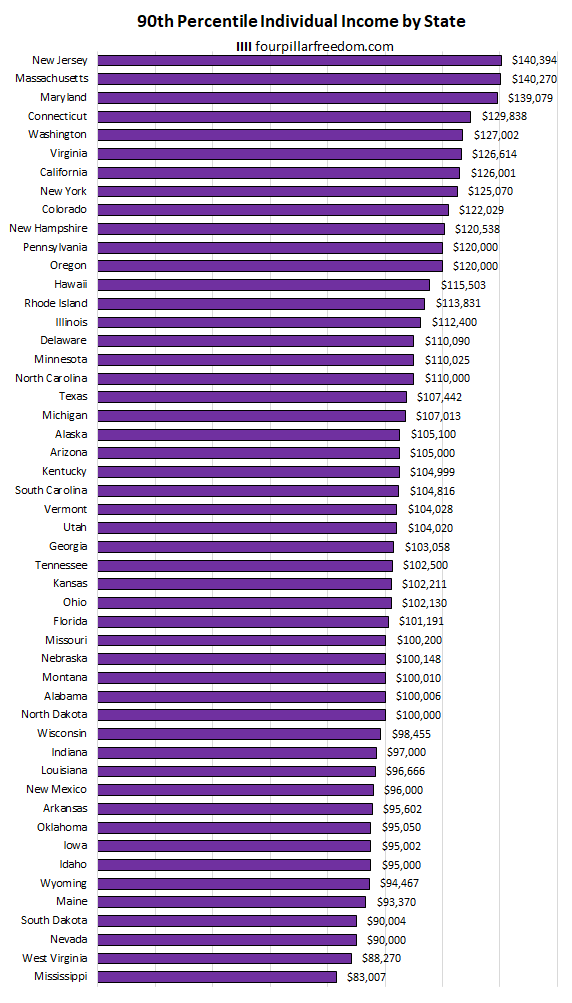
The following chart shows the annual income needed to be at the 90th income percentile for each state:

New Jersey just edges out Maryland for the top spot with an annual income of $140,394 needed to be at the 90th percentile for individual income-earners.
Once again Mississippi ranks the lowest on the list with an annual individual income of just $83,007 needed to be at the 90th percentile.
What Percentage of Individuals Earn Over $50k? Over $100k?
The following table shows the percentage of individuals who earn over $50k in each state:

Maryland leads the way with 49% of individuals earning over $50k per year while Mississippi brings up the tail end with just 29% of individuals earning over $50k per year.
The following table shows the percentage of individuals who earn over $100k in each state:

It’s pretty incredible to see that over 1 in 5 individuals in Maryland earn over $100k per year while only about 1 in 14 individuals in West Virginia, South Dakota, and Nevada do so. And in Mississippi, only about 1 in 16 individuals earn $100k or more year.
Visualizing Household Incomes in Every U.S. State
Next up, here are some charts and tables that illustrate the exact same statistics as above, except these numbers are for households instead of individuals.
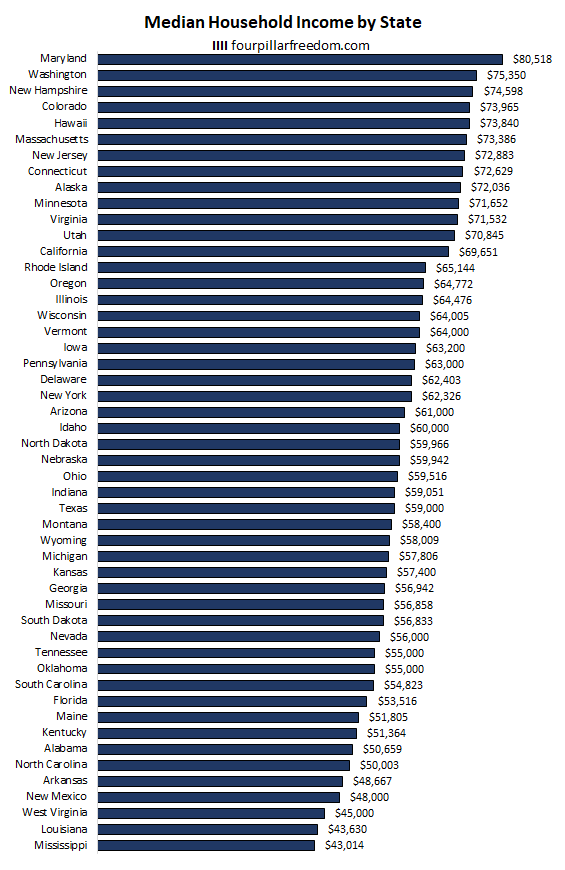
The following chart shows the median annual income for households in each U.S. state:

Maryland leads the way with a median annual income of $80,518 while Mississippi brings up the bottom of the list with a median annual income of just $43,014.
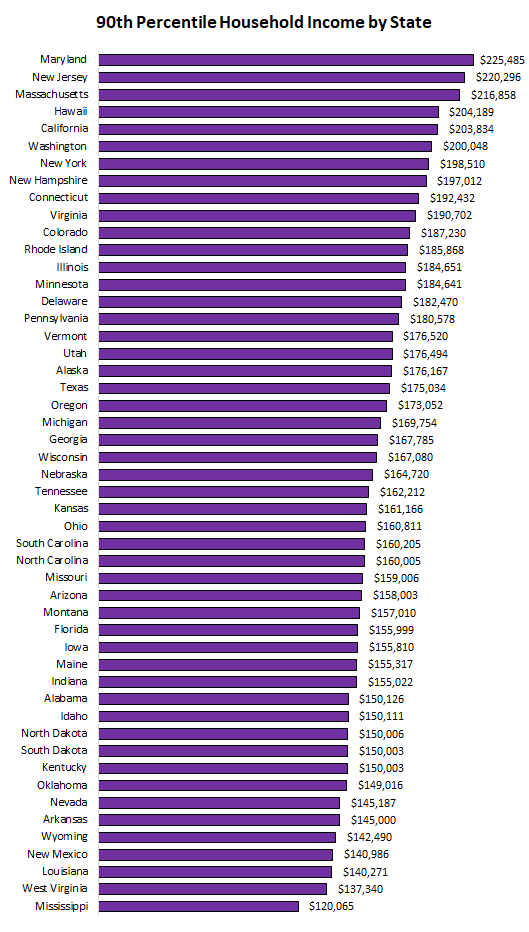
The following chart shows the annual household income needed to be at the 90th income percentile for each state:

Maryland takes the top spot with an annual household income of $225,485 needed to be at the 90th percentile.
Once again Mississippi ranks the lowest on the list with an annual household income of just $120,065 needed to be at the 90th percentile.
What Percentage of Households Earn Over $50k? Over $100k?
The following table shows the percentage of households that earn over $50k in each state:

Maryland, Utah, and Colorado all leads the way with a whopping 67% of households earning over $50k per year while Mississippi brings up the tail end with just 44% of households earning over $50k per year.
The following table shows the percentage of households that earn over $100k in each state:

Maryland tops the list with 40% of households earning over $100k per year while Mississippi brings up the tail end with just 16% of households earning over $100k per year.
Thanks for reading 🙂
- The Ad Revenue Grid - August 6, 2021
- Attract Money by Creating Value for a Specific Audience - July 13, 2021
- The 5-Hour Workday - March 26, 2021
Full Disclosure: Nothing on this site should ever be considered to be advice, research or an invitation to buy or sell any securities, please see my Terms & Conditions page for a full disclaimer.
