 8 min read
Imagine that it is January 4th, 1950. You’re sitting in your living room drinking some tea. Earlier that day, the S&P 500 closed at a price of $16.85.
You sit and think to yourself, I wonder if the S&P 500 will ever be this low again.
It turns out that a little over a week later on January 12th, 1950, the S&P 500 did close lower at $16.76. The next day, it closed even lower at $16.67.
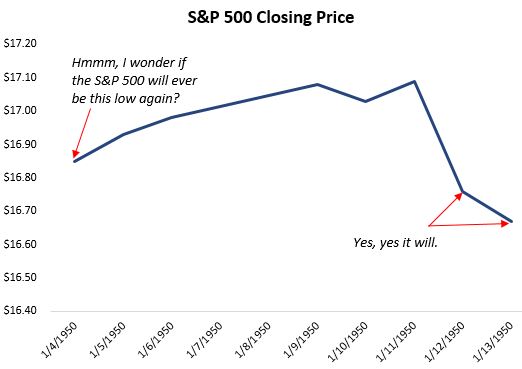
Now suppose it’s January 14th and you find yourself contemplating whether or not you should buy some shares at the current price.
Last week, on January 4th, you would have been better off just waiting because eventually the S&P 500 would have offered you a lower price to buy at. So, you decide to wait because perhaps you’ll be able to buy at an even lower price next week.
It turns out that you would have made the wrong decision because the S&P 500 would never be that low ever again.
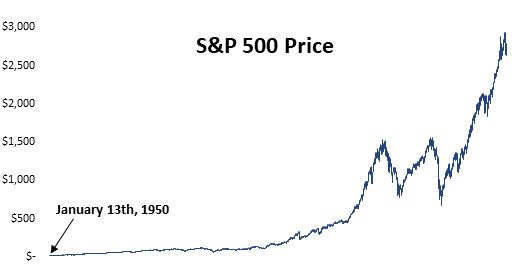
This brings up an interesting question:
On any given day since 1950 if you thought to yourself, I wonder if the S&P 500 will ever be this low again, how many times would the answer have been No?
Analyzing Historical S&P 500 Data
To answer this question, I downloaded historical data for the daily price of the S&P 500 from January 4th, 1950 to December 1st, 2018 from Yahoo Finance.
I looked at the closing price of the S&P 500 each day and checked to see if the closing price would ever be that low again on any day in the future. Here’s an example of what the data looked like:
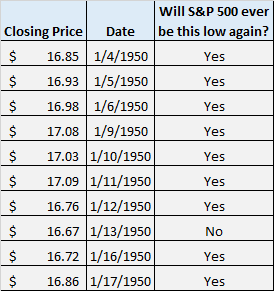
Note: Since the market is only open during weekdays, not every date is shown (e.g. January 7th and January 8th are not shown in the picture above because those are weekend days).
There were a total of 17,341 days in this dataset. For 95.3% of those days, the S&P 500 did close lower on some day in the future.
This number sounds high, but keep in mind that the stock market takes minor dips all the time, despite trending upward over the course of years and decades. For example, take a look at the price of the S&P 500 from the start to the end of the year in 1950:
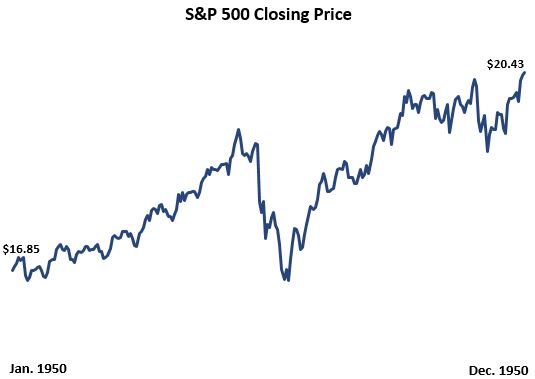
1950 was a fantastic year for the stock market, but the path along the way was volatile. During most days if you thought to yourself, I wonder if the price of the S&P 500 will be lower at some point later this year, the answer was almost always yes.
Naturally, the next question you might ask is, during how many days in the future will the S&P 500 be lower than it is today?
To answer this, I looked at the closing price of the S&P 500 each day and checked to see during how many days in the future the S&P 500 closed at a lower price. Here’s an example of what the data looked like:
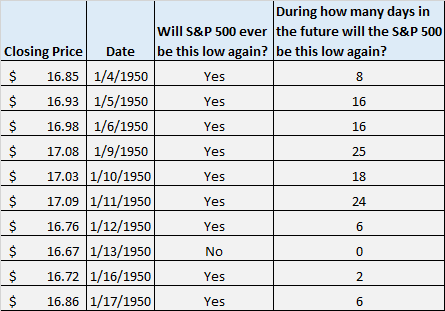
The following table and chart shows the percentiles for the numbers of days the S&P 500 closed lower than the current day:

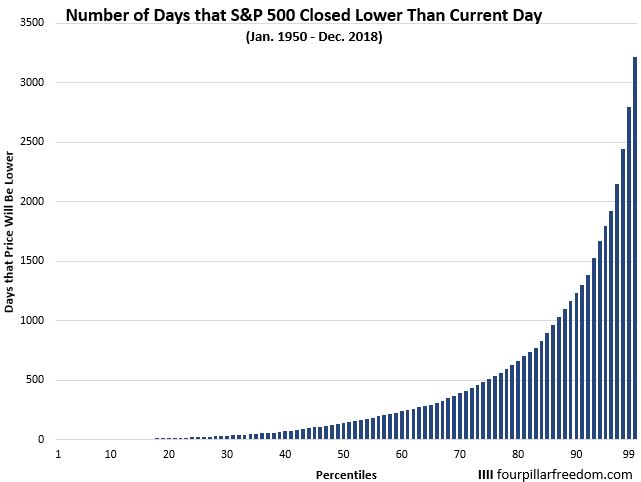
Here is how to interpret these numbers:
During 10% of the total days since 1950, the S&P 500 closed at a lower price just 3 times or less at some point in the future.
During 20% of the days, the S&P 500 would closer at a lower price just 14 times or less at some point in the future.
During 50% of the days, the S&P 500 would closer at a lower price 142 times or less at some point in the future.
This leads to another question: during the days that the price will be lower in the future, how much lower will it actually be?
To answer this, I looked at the closing price for each day, then identified the days in the future when it closed at a lower price. Among those days when it closed at a lower price, I looked at the max amount that it closed lower. Here’s an example of what the data looked like:
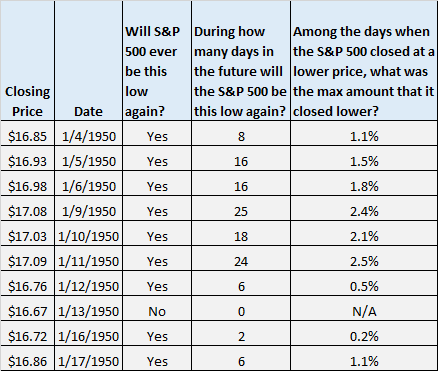
For example, on January 4th, 1950, the S&P 500 closed at $16.85. You want to know if the S&P 500 will ever close that low ever again. The answer turns out to be yes.
Then, you want to know during how many days in the future it will close at a lower price. The answer is 8 days.
Then, among those 8 days you want to know the max amount that it closed lower. It turns out to be 1.1%.
I found these numbers for every single day since January 4th, 1950.
The following table and chart shows the percentiles for the max amount that the S&P 500 closed lower than the current day:

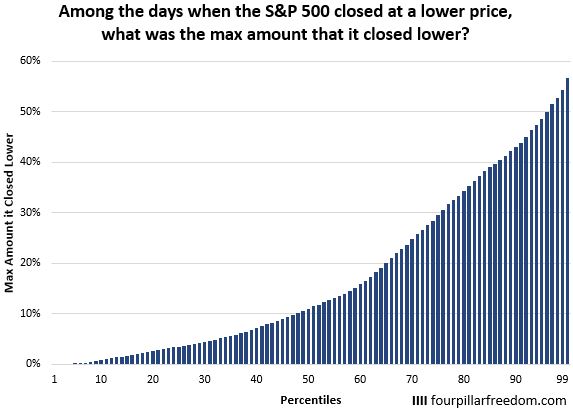
Here is how to interpret these numbers:
During 10% of the total days since 1950 when the S&P 500 closed at a lower price at some point in the future, the max amount it closed lower was just 0.8%.
During 20% of the total days since 1950 when the S&P 500 closed at a lower price at some point in the future, the max amount it closed lower was just 2.6%.
During 50% of the total days since 1950 when the S&P 500 closed at a lower price at some point in the future, the max amount it closed lower was 11%.
This leads to one more question: what is the latest date that the S&P 500 will close at a lower price than the price it’s at today?
In other words, we know that the S&P 500 will probably close at a lower price at some point in the future, but how far into the future will we have an opportunity to buy at a lower price?
To answer this, I looked at the S&P 500 closing price for each day, then identified the days in the future when it closed at a lower price. Among those days when it closed at a lower price, I found the latest date. Here’s an example of what the data looked like:
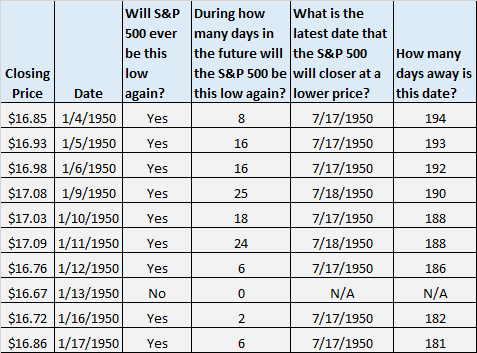
For example, on January 4th, 1950 the S&P 500 closed at $16.85. The S&P 500 would close at a lower price during 8 days in the future. The latest date that it would close at a lower price was July 7th, 1950, which was 194 days away.
I found these numbers for every single day since January 4th, 1950.
The following table and chart shows the percentiles for the max amount of days away that the S&P 500 closed at a lower price than the current day:

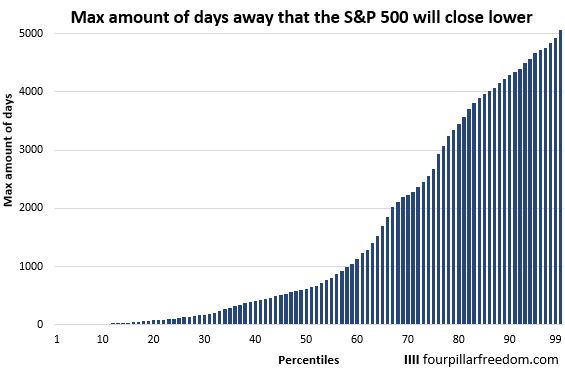
Here is how to interpret these numbers:
During 10% of the total days since 1950 when the S&P 500 closed at a lower price at some point in the future, the latest date that it closed lower was just 15 days later.
During 20% of the total days since 1950 when the S&P 500 closed at a lower price at some point in the future, the latest date that it closed lower was just 74 days later.
During 50% of the total days since 1950 when the S&P 500 closed at a lower price at some point in the future, the latest date that it closed lower was just 620 days later.
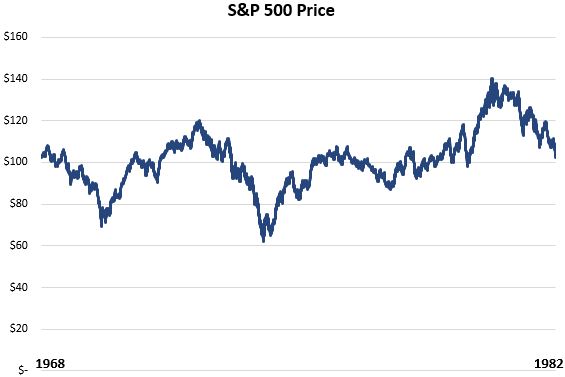
In the most extreme case, the max amount of days that the S&P 500 closed lower between two different dates was 5,070 days between September 24th, 1968 and August 12th, 1982:
Conclusion
Here is a recap of what we learned in this post:
If you randomly selected a day from January 4th, 1950 to December 1st, 2018 and looked at the price of the S&P 500, there was a 95.3% chance that the price would eventually be lower at some point in the future. In a quarter of those situations, the price would only be lower for 22 days or less in the future. In half of those situations, the price would only be lower for 142 days (a little less than 5 months) or less in the future.
In addition, when the price of the S&P 500 was lower in the future, half of the time it was only 11% or lower. And during half of the instances when the S&P 500 would be lower in the future, it was only lower for the next 620 days or less.
Based on all of this info, it might be tempting to look at the price of the S&P 500 on a given day and think to yourself, I might as well wait for the price to drop since I know there’s a good chance that it will in the future.
But keep in mind that even though the price likely will drop in the future, it’s nearly impossible to predict how much it will drop along with when the price will hit a low point from which it will never return again.
Along with attempting to time the bottom of the market, you’ll incur trading fees and taxes when you attempt to buy and sell at just the right moments.
When you attempt to time the market, you could get lucky like if you waited on January 4th, 1950 until January 13th, 1950 to buy shares when the S&P 500 offered a lower price. On the other hand, if you chose to wait on January 13th for a lower price, you’d still be waiting to this day because the S&P 500 never returned to that low of a price ever again.
Further Reading:
Here’s How the S&P 500 Has Performed Since 1928
A Recap of Warren Buffett’s 10 Year Bet on the S&P 500
- The Ad Revenue Grid - August 6, 2021
- Attract Money by Creating Value for a Specific Audience - July 13, 2021
- The 5-Hour Workday - March 26, 2021
Full Disclosure: Nothing on this site should ever be considered to be advice, research or an invitation to buy or sell any securities, please see my Terms & Conditions page for a full disclaimer.

Very nice summary and analysis! I think the upshot is that one simply cannot time the market effectively enough (especially after considering the associated frictions) to make it worth the hassle.
Happy to have stumbled across your blog!
Agreed – timing both the tops and the bottoms is nearly impossible and almost always not worth the hassle. Thanks for the kind words! 🙂