
5 min read
The S&P 500 is a stock market index that tracks the 500 largest publicly traded companies in the U.S. and captures about 80% coverage of the total U.S. market cap.
Warren Buffett is a long-time advocate of S&P 500 index funds. He believes that investors can outperform most actively managed funds if they simply buy and hold shares in an S&P 500 index fund for several decades.
He even once made a bet that the S&P 500 could outperform any group of actively managed funds over a ten-year period and easily won that bet.
Related: Visualizing Warren Buffett’s Favorite Stock Market Index
Today I’ll take a look at how the S&P 500 has performed since 1928. I’ll look at how it performed on a yearly basis as well as how it performed during every 10, 20, 30, and 40-year investment period since 1928. I’ll be using inflation-adjusted annual returns.
Let’s jump in!
S&P 500 Inflation-Adjusted Annual Returns
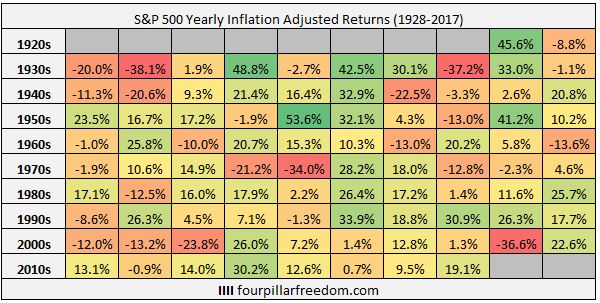
This table shows the inflation-adjusted annual returns for the S&P 500 from 1928 to 2017:
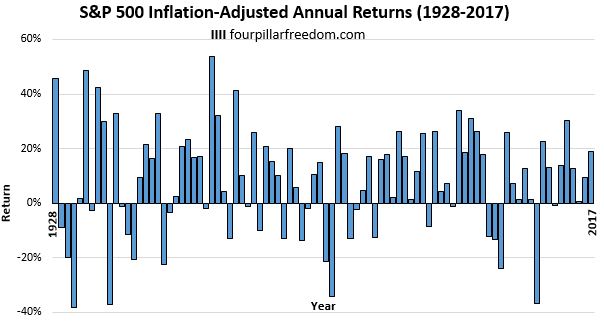
Here’s a visual look at the S&P 500 inflation-adjusted returns for every year since 1928:
Some Interesting Observations
- The inflation-adjusted annual return of the S&P 500 varies based on the starting year you choose to look at. For example, the inflation-adjusted annual return (let’s call this IAAR, for short) from 1928 to 2017 was 6.5%. The IAAR from 1932 to 2017 was 7.3%. The IAAR from 1942 to 2017 was 7.6%. Depending on which time period you look at, the long-term IAAR for the S&P 500 is somewhere between 6% and 8%.
- During the best year (1954), the S&P 500 gained 53.6%.
- During the worst year (1931), the S&P 500 lost 38.1%.
- The S&P 500 experienced a gain of 25% or more in 19 out of 90 years (21.1% of years)
- The S&P 500 experienced a loss of 10% or more in 17 out of 90 years (18.9% of years)
Long-Term S&P 500 Returns
While it’s interesting to look at S&P 500 returns for individual years, most people don’t invest in index funds for one-year periods; they invest for several decades. This is why it’s more interesting to look at decade-long annualized returns.
The table below shows the 10, 20, 30, and 40-year S&P 500 annualized returns for every year since 1928:

Here’s a summary of these returns:

10-Year Investment Periods
This chart shows the S&P 500 annualized returns for every 10-year period since 1928:
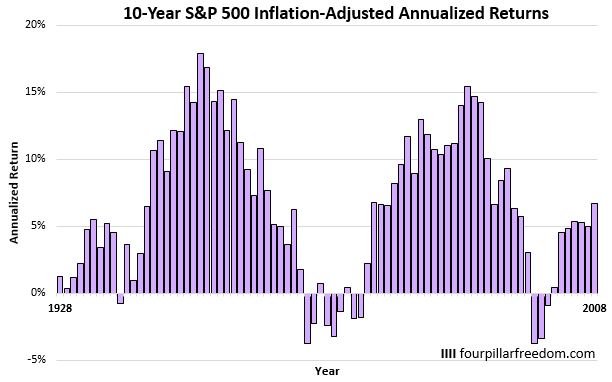
During the best 10-year period (1949-1958), the S&P 500 delivered 17.9% annual returns.
During the worst 10-year period (1999-2008), the S&P 500 delivered -3.8% annual returns.
The median annual returns for 10-year periods since 1928 has been 6.5%.
The S&P 500 delivered negative annualized returns in 11 out of 81 10-year periods (13.6% of 10-year periods) since 1928.
20-Year Investment Periods
This chart shows the S&P 500 annualized returns for every 20-year period since 1928:
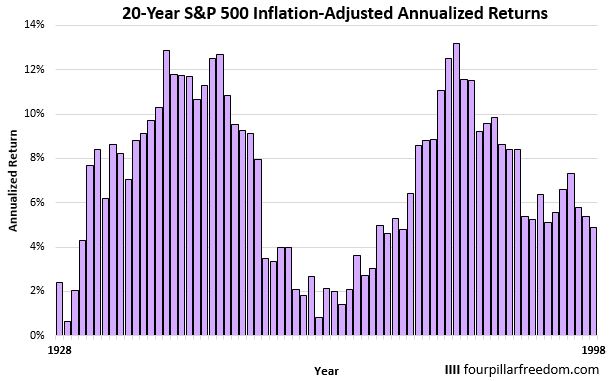
During the best 20-year period (1980-1999), the S&P 500 delivered 13.2% annual returns.
During the worst 20-year period (1929-1948), the S&P 500 delivered 0.6% annual returns.
The median annual returns for 20-year periods since 1928 has been 7.3%.
The S&P 500 never delivered negative annualized returns in any 20-year period.
30-Year Investment Periods
This chart shows the S&P 500 annualized returns for every 30-year period since 1928:
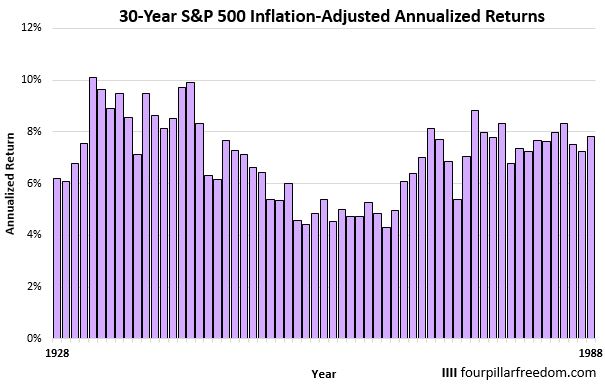
During the best 30-year period (1932-1961), the S&P 500 delivered 10.1% annual returns.
During the worst 30-year period (1965-1994), the S&P 500 delivered 4.3% annual returns.
The median annual returns for 30-year periods since 1928 has been 7.1%.
The S&P 500 never delivered negative annualized returns in any 30-year period.
40-Year Investment Periods
This chart shows the S&P 500 annualized returns for every 40-year period since 1928:
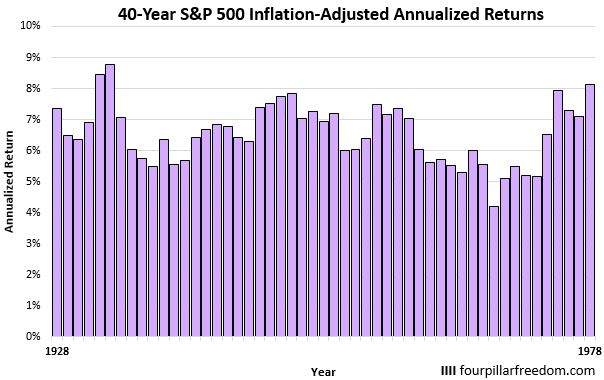
During the best 40-year period (1933-1972), the S&P 500 delivered 8.8% annual returns.
During the worst 40-year period (1969-2008), the S&P 500 delivered 4.2% annual returns.
The median annual returns for 40-year periods since 1928 has been 6.5%.
The S&P 500 never delivered negative annualized returns in any 40-year period.
Conclusion
So there you have it. The S&P 500 has typically delivered 6-8% annual returns over the long haul even after inflation, although some periods have delivered much higher returns than others.
It’s encouraging to see that the S&P 500 has never experienced losses during any 20-year period since 1928 and that during the worst 30-year period, the market still delivered 4.3% annual returns even after inflation.
It’s difficult to predict stock market returns going forward, but if the future resembles the past, then investors who maintain a long-term investment horizon and resist the urge to buy and sell excessively will likely be rewarded by the market.
- The Ad Revenue Grid - August 6, 2021
- Attract Money by Creating Value for a Specific Audience - July 13, 2021
- The 5-Hour Workday - March 26, 2021
Full Disclosure: Nothing on this site should ever be considered to be advice, research or an invitation to buy or sell any securities, please see my Terms & Conditions page for a full disclaimer.
