3 min read
One of my favorite data-driven blogs, DQYDJ, recently shared data for 2017 individual income percentiles.
From DQYDJ:
This data is for individuals in the United States, including income earned between January and December of 2017.
Income is defined as all income earned from any source not just from a primary job!
This can be wage income (including multiple jobs), business income, investment income, and all sorts of other ways people earn money.
Here are the income percentile for individuals in 2017 along with the corresponding income:

Interesting Observations
- The median individual income for 2017 was $39,000.
- An individual needed to earn at least $112,115 to be in the top 10% of earners.
- An individual needed to earn at least $300,101 to be in the top 1% of earners.
- If you earned $50,000 in 2017, you earned more than 61% of all individuals.
- If you earned $100,000 in 2017, you earned more than 87% of all individuals.
Visualizing the U.S. Individual Income Percentiles
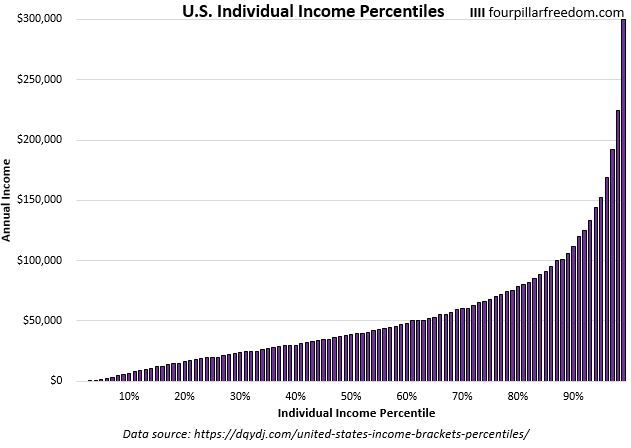
The following chart gives a visual look at the income percentiles:

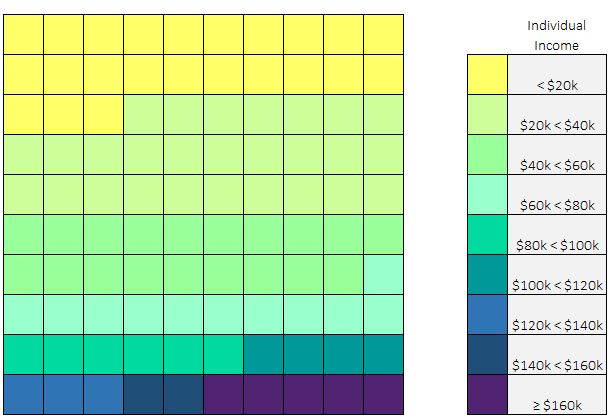
Another way to visualize this data is using 100 tiny blocks:

In 2017, 23% of individuals earned less than $20,000:

In 2017, 50% of individuals earned less than $40k:

In 2017, 69% of individuals earned less than $60k:

In 2017, 80% of individuals earned less than $80k:

In 2017, 14% of individuals earned $100k or more:

For a more in-depth look at how these numbers were derived, along with how they compare to 2016 individual income numbers, check out the full post from DQYDJ.
- The Ad Revenue Grid - August 6, 2021
- Attract Money by Creating Value for a Specific Audience - July 13, 2021
- The 5-Hour Workday - March 26, 2021
Full Disclosure: Nothing on this site should ever be considered to be advice, research or an invitation to buy or sell any securities, please see my Terms & Conditions page for a full disclaimer.

Interesting data. I don’t think I’ve seen it for individuals just household.
I typically see household data as well. It was awesome to see that DQYDJ was able to provide individual income data.
As always, love the visualizations that go along with your post.
Thanks SAHD FIRE!
Is this only for individuals of working age who have a job? How was this measured? Are they including 2 year olds, retirees, etc? I don’t really understand what how this is measured. If it included every individual in the United States then of course there are a lot of people under 15 or over 65 who earn zero pulling these averages way down.
This data is for individuals 15 years or older who earned income in 2017. Income is defined as pre-tax earnings from wages (including multiple jobs), business income, investment income, and any other form of earnings.