
3 min read
The following table shows the annual returns for the total U.S. stock market, the total international developed Ex-U.S. stock market, and the total U.S. bond market since 1987:
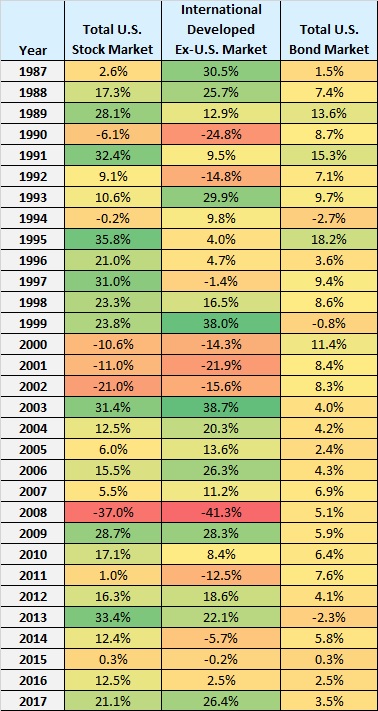
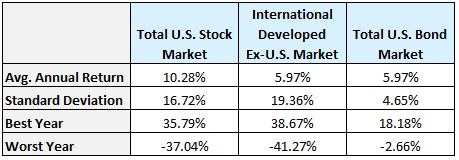
In general, U.S. stocks significantly outperformed both international stocks and U.S. bonds during this 31-year time period. Also, U.S. bonds delivered the same annual returns as international stocks with far less volatility:
It’s also interesting to note the relationship between these asset classes:
- The annual returns of U.S. stocks and international stocks are positively correlated. When U.S. stocks go up, international stocks tend to go up as well.
- The annual returns of U.S. stocks and U.S. bonds are uncorrelated.
- The annual returns of international stocks and U.S. bonds are slightly negatively correlated. When international stocks go up, U.S. bonds tend to go down.
We can use a correlation coefficient to quantify exactly how correlated the annual returns between any two asset classes actually are:
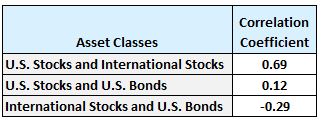
A correlation coefficient above zero indicates that two asset classes have a positive relationship: when one goes up, the other tends to go up as well. A correlation coefficient below zero indicates that two asset classes have a negative relationship: when one goes up, the other tends to go down.
A correlation coefficient of 1 would mean that two asset classes are perfectly positively correlated and a correlation coefficient of -1 would mean that two asset classes are perfectly negatively correlated.
The scatterplots below show the annual returns for different combinations of these asset classes. Each dot represents a single year.
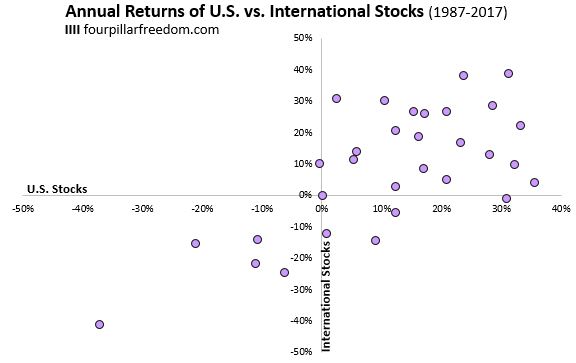
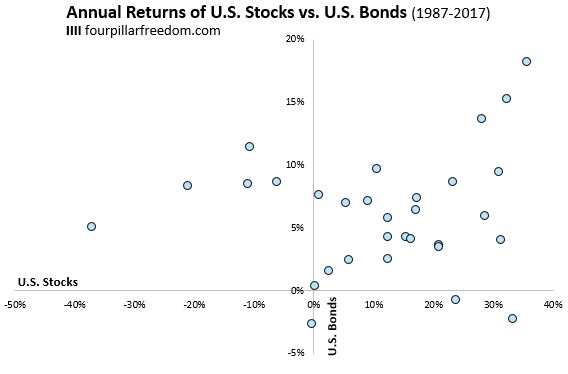
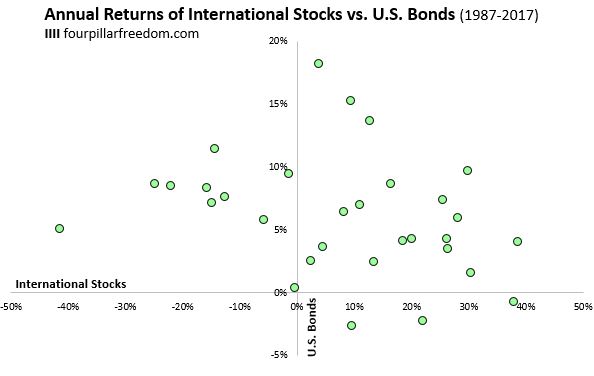
There are some neat observations we can draw from these plots. Namely, during the 31-year period from 1987 to 2017:
- There was only one year when U.S. stocks had negative returns and international stocks had positive returns in the same year (1994, U.S. = -0.2%, Int’l = 9.8%)
- There was only one year when both U.S. stocks and U.S. bonds had negative returns (1994, U.S. stocks = -0.2%, U.S. bonds = -2.7%)
- There was never a year in which both international stocks and U.S. bonds both had negative returns.
Here’s how a one-time $10,000 investment at the beginning of 1987 in each of these three asset classes grew over time:
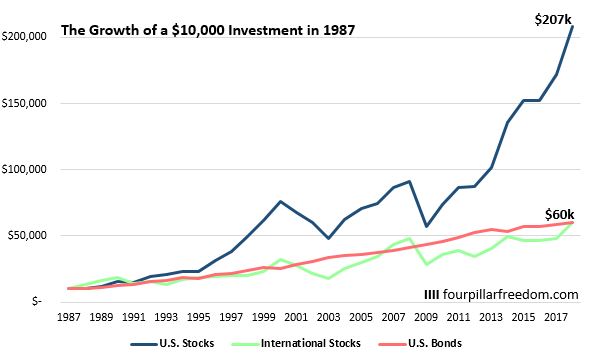
A $10,000 investment in U.S. stocks grew to an unbelievable $207k while the same investment in either U.S. bonds or international stocks grew to only $60k.
And here’s how an annual $10,000 investment at the start of each year since 1987 grew over time:
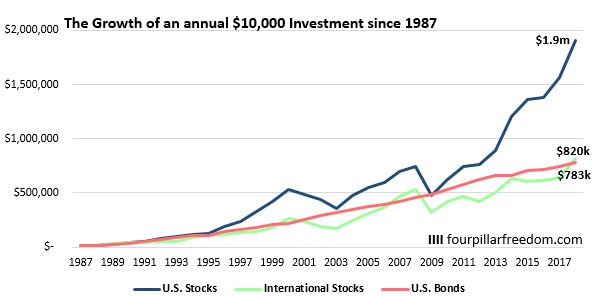
Someone who invested $10,000 each year in U.S. stocks would have accumulated $1.9 million by the end of 2017. Someone who did the same with international stocks would have accumulated $820k, and someone who did the same with U.S. bonds would have accumulated $783k.
Technical notes: Keep in mind that this analysis covers a specific time period: 1987 – 2017. It’s possible that each of these three asset classes could have performed better or worse during different time periods. I chose to analyze this data because it was readily available from Portfolio Visualizer.
- The Ad Revenue Grid - August 6, 2021
- Attract Money by Creating Value for a Specific Audience - July 13, 2021
- The 5-Hour Workday - March 26, 2021
Full Disclosure: Nothing on this site should ever be considered to be advice, research or an invitation to buy or sell any securities, please see my Terms & Conditions page for a full disclaimer.

It seems strange to do this now, in a year when the US stock market is down for the year. Why now?
I’m not sure what you mean. Why is it strange to do this now?
If only I had started investing $10K per year as a sophomore in high school… I would be a very happy camper right now. LOL
Definitely a timely analysis with great visuals to boot. Good work Zach! Hopefully this will ease anxiety in some to stay the course and follow their plan. It’s easy to say you are confident until there is a significant downturn and the emotions begin to affect logical thinking.
I also like seeing the comparison between US/INT/BONDS over the time period. I personally no longer hold international in my portfolio because of the global footprint the Total Market Funds provide already. Your analysis reinforces my decision. Thanks
Thanks for the feedback! I don’t hold international currently either because about half of all revenue from S&P 500 companies is made overseas anyway.