1 min read
The 2012 – 2016 American Community Survey is a massive 5-year study conducted by the U.S. Census Bureau that provides estimates on different demographic and housing numbers across the U.S.
Earlier this week I used data from this study to visualize the median household income in all 50 states.
Today I built a dashboard using even more granular data that shows the median household income in over 25,000 towns, cities, CDPs, and villages across the U.S.
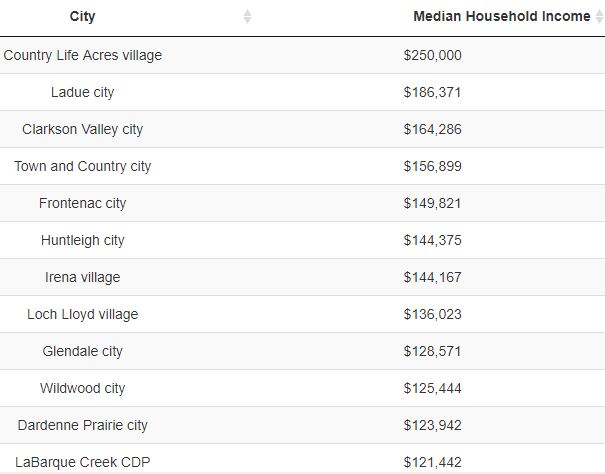
On the first tab of the dashboard, you pick a state from a drop-down list and a table displays the median household income for every city, village, town, and CDP (census-designated place) in that state:

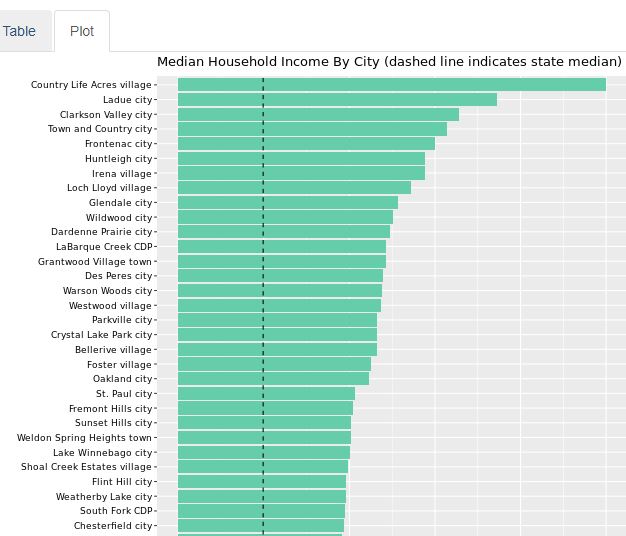
On the second tab, the median household income for each city, village, town, and CDP is displayed in a bar plot. A dashed line on the chart indicates the median household income for that given state:

Check out the dashboard here.
(As a heads up, the plot sometimes takes a minute to load on the dashboard)
- The Ad Revenue Grid - August 6, 2021
- Attract Money by Creating Value for a Specific Audience - July 13, 2021
- The 5-Hour Workday - March 26, 2021
Full Disclosure: Nothing on this site should ever be considered to be advice, research or an invitation to buy or sell any securities, please see my Terms & Conditions page for a full disclaimer.
