2 min read
In a recent post, I explained that saving the first $100k is the hardest because it takes the longest. Fortunately, once you have the first $100k under your belt, each subsequent $100k takes less and less time to save, assuming constant yearly savings and investment returns.
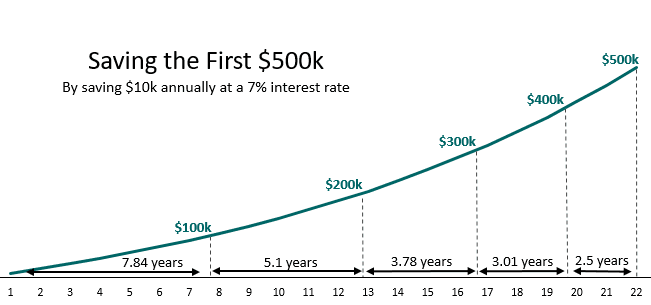
For example, if you save $10k per year and your savings grow at a 7% annual interest rate, here’s how long it will take to save $500k:

Notice how each $100k takes less time to save than the previous.
I received a lot of positive feedback about this chart, but something many people requested was an interactive chart that lets you change the yearly savings and interest rates, so you can plug in your own numbers.
That’s why I made the spreadsheet below. It lets you change the yearly savings and annual interest rate to see how different inputs affect how long it takes to save each $100k, all the way up to $2 million.
Click on the numbers in the boxes below to change the inputs. The chart will automatically update for you.
The blue line represents net worth. The purple line along the bottom shows how many years it takes to save each additional $100k.
For example, if you save $15,000 each year at a 4% interest rate, it takes 6 years to save the first $100k, then 4.9 years to save the next $100k, etc.
You can download the spreadsheet and see all the formulas used for the chart by clicking the ‘download’ button on the bottom right.
This is my first time embedding an Excel spreadsheet in WordPress, so if the chart doesn’t show up in your browser or you have trouble downloading it, feel free to let me know!
Enjoy 🙂
- The Ad Revenue Grid - August 6, 2021
- Attract Money by Creating Value for a Specific Audience - July 13, 2021
- The 5-Hour Workday - March 26, 2021
Full Disclosure: Nothing on this site should ever be considered to be advice, research or an invitation to buy or sell any securities, please see my Terms & Conditions page for a full disclaimer.

Awesome Zach, thanks for the link to the sheet. Will continue to follow, great stuff!
PS, for the sheet, I had to reset the data labels because they showed up as [] values (no data, just brackets.
Thanks, Daan!
Very nice. It may take even less time to reach each milestone if you factor in some monthly or quarterly compounding.
Very true. This uses annual compounding, which could be seen as conservative.
Nice job.
Thank you!
Very nice, in my experience your salary compounds even faster than your investments if you have a great career so that the compression of milestones is even faster than what you’ve shown, assuming you don’t let your lifestyle inflate.
Great point, Steve. These calculations don’t account for salary increases, so these numbers could be conservative.