
3 min read
Over the last nine years, the S&P 500 has been on a rampage, rising from a market low of around $757 in March 2009 to it’s current price of $2,648.
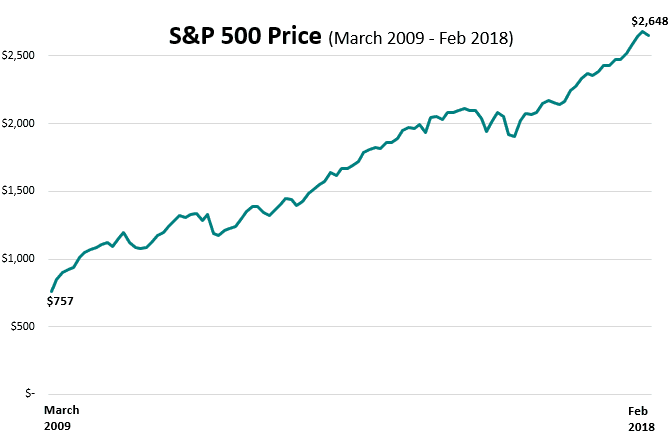
However, in the last two days we have seen the price drop about 7%, which can be seen by this hiccup at the end of the graph:
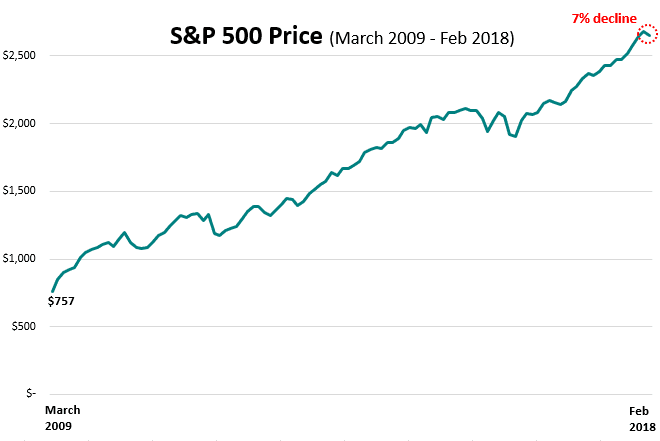
Where will the price go from here? Nobody has a clue. Anyone who claims they know is lying.
Perhaps the market will rebound and continue to surge higher through 2018. Or maybe this really is the start of a correction. Only time will tell.
The only thing we know for sure is how the S&P 500 has historically performed, which is the source for the following thought experiment:
If we experience the equivalent of the worst S&P 500 annual returns ever in 2018, how far back would that take investors? Let’s have a look…
A Thought Experiment
This table shows the five years with the worst S&P 500 returns ever:
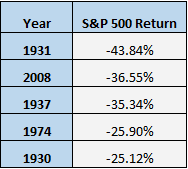
Let’s imagine that during the rest of 2018 the S&P 500 sheds 43.84% of it’s current price, just like it did during the Great Depression in 1931. Here’s what that would look like:
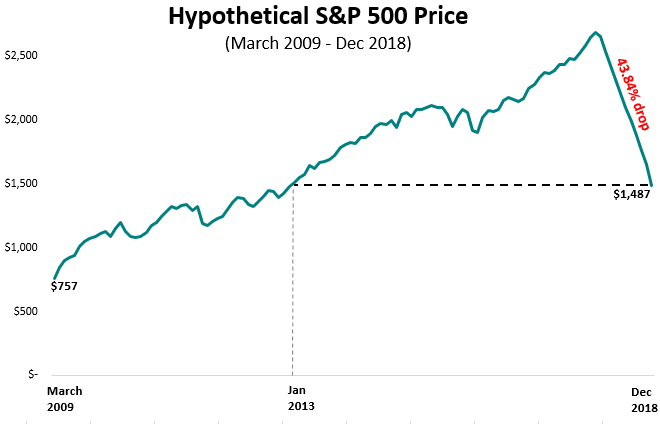
This would take us back to the same price we saw in January 2013. This would match the worst annual return ever, which isn’t an impossible scenario, but it’s unlikely. Even during the recent financial crisis, we didn’t see a price drop this severe.
Suppose instead we experienced a 25.90% drop, just like we saw in 1974. This would still be a massive crash, but not nearly as horrific as the 43.84% collapse of 1931. Here’s what that would look like:
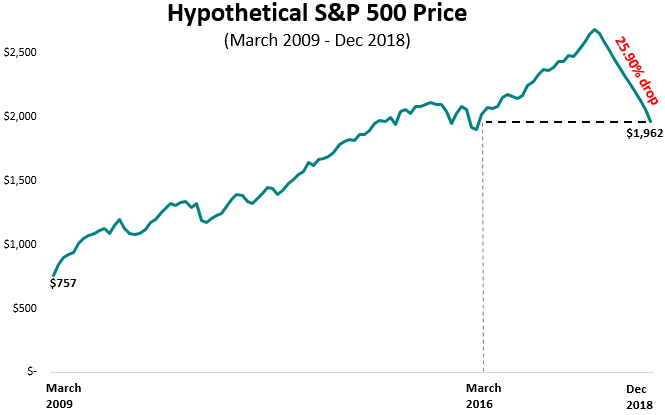
A 25.90% drop from it’s current price would leave the S&P 500 at the same price point as March 2016.
That’s incredible.
Keep in mind that neither of these graphs account for dividends, either.
The Takeaway
This thought experiment illustrates two points:
1. The S&P 500 rally over the last two years in particular has been phenomenal. A 25.9% correction, equivalent to the fourth-worst S&P 500 annual return ever, would set investors back less than two years.
2. The investors who have remained in the market over the last nine years have been handsomely rewarded. Even a 1931-Style 43.84% drop wouldn’t be enough to take away the gains from money invested during 2009 – 2013.
Portfolio Size Matters
As I wrote in this post, the size of your portfolio determines how much investment returns matter. If we do experience a ~37% drop in price, like we saw in 2008, here’s how different-sized portfolios would be impacted:
(The left side of this graph shows how much money you would lose if all of your portfolio was invested in the S&P 500 and we experienced a 37% drop. It’s titled “Worst Year Ever” because I only considered returns since 1950 in that post.)
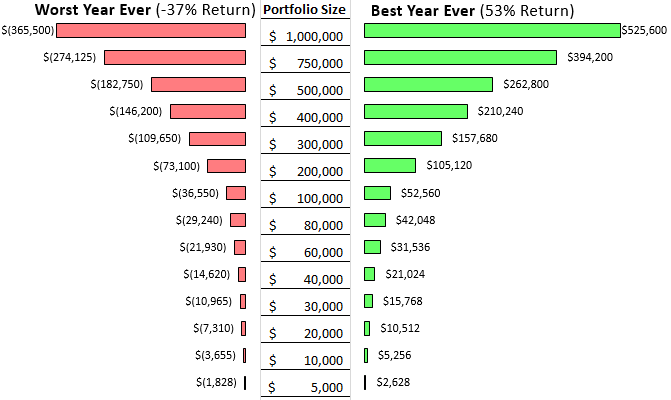
Notice how smaller portfolios are hardly impacted by market drops. For someone like me, with close to $60k invested in stocks alone, this type of drop would result in a $21,930 loss. At the moment, I’m able to save close to $50,000 per year, which means my net worth would still increase over the course of the coming year, despite a market drop.
As a young person, with a long investing time horizon, I wouldn’t be fazed by a market crash. I would simply gobble up more shares at cheaper prices and let compound interest do it’s work over the next several decades.
Yesterday I picked up a few shares of VTI (Vanguard Total Stock Market ETF) and I plan to continue doing so if the market keeps declining. I don’t care what type of returns I earn over the coming days, weeks, or months. I am more concerned with building wealth over the course of decades. For me, a market drop is simply an opportunity to invest at cheaper prices.
If you’re looking for some great investing wisdom from someone much wiser and more experienced than myself, check out Jim Collin’s Stock Series. It’s a massive 31-part series (and growing) on the nature of the stock market, how to think about market crashes, and where to invest your money for the long haul.
- The Ad Revenue Grid - August 6, 2021
- Attract Money by Creating Value for a Specific Audience - July 13, 2021
- The 5-Hour Workday - March 26, 2021
Full Disclosure: Nothing on this site should ever be considered to be advice, research or an invitation to buy or sell any securities, please see my Terms & Conditions page for a full disclaimer.

Wow, the fact that we’ve been on such a crazy bull run is just nuts to me. Looking at the worst drop in history and seeing that it only ‘resets’ us back to 2013? Crazy.
Interesting post, particularly the graphs.
It’s really not the end of the world for investors that hold, but all the ones that sell loose depending on when they sell and buy back in. Companies like Fidelity, Scott Trade, AI Traders – basically brokers, get rich. They love volatility.
Cycle repeats.
You should only have a 1/5th of your wealth in stocks, the rest in properties and businesses you operate, with 10-15% cash to get deals and advert crisises.
There is too much incentive for stock investment which is why the market tends to have corrections.
Thanks for this. I’m sharing it in my FB group. Hopefully people pay attention!