
4 min read
Recently I have been thinking a lot about the 4% Rule, which states that once you save up 25 times your annual expenses, you can retire and “safely” withdraw 4% of your portfolio each year in retirement with a high likelihood that you’ll never run out of money.
This rule works wonderfully if you plan on never working again once you retire. But what if you enjoy working?
Or what if you’re at the beginning of your financial journey and you have no desire to work at a meaningless job for 10 – 15 years just to save enough money to be financially independent?
Or what if you want to work off and on over the next few decades, opting to take mini-retirements along the way?
If you fall into this camp of thinking, then saving 25 times your annual expenses seems a bit excessive. Instead of saving $1 – $2 million, what if you only saved a few hundred thousand before quitting your job and then started earning enough income to cover your expenses through work you enjoy?
If you choose this route, how will your savings grow over time if you don’t touch them?
This is the motivation for the following analysis. I want to know how different amounts of savings have historically grown over time without additional yearly contributions.
The Analysis
I went back and looked at S&P 500 returns from 1928 – 2016 to see how different amounts of savings grew over different periods without any additional yearly contributions.
NOTE: I realize that most people won’t have all of their savings invested in the S&P 500, but I’m making this assumption for simplicity.
Let’s see how $100k invested in the S&P 500 has grown historically without any additional yearly contributions.
This chart shows how $100k grew over the course of every 10-year period from 1928 to 2016. Each line represents a distinct 10-year period. Ending amounts are inflation-adjusted. Dividends are assumed to be reinvested.
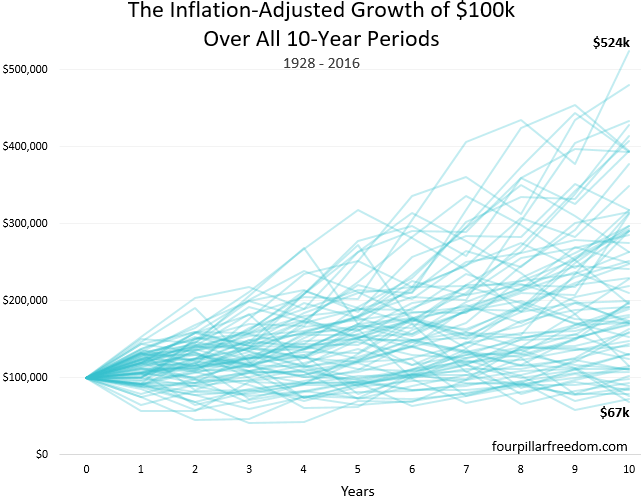
During the best 10-year period (1949 – 1958), $100k grew to an incredible $524k, equivalent to 18% compounded annual returns.
During the worst 10-year period (1999 – 2008), $100k dropped in value to $67k, equivalent to -3.8% compounded annual returns.
The median ending value across all 10-year periods was $191k (6.7% compounded annual returns), nearly double the original amount, even after adjusting for inflation.
Next, here’s a look at how $100,000 grew over every 20-year period between 1928 and 2016:
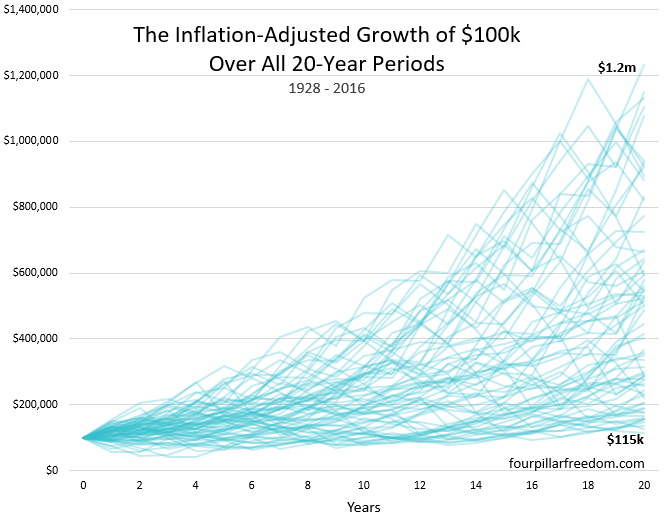
Best 20-year period (1980 – 1999) – $100k grew to $1.23 million (13.4% comp. ann. return)
Worst 20-year period (1929 – 1948) – $100k grew to $115k (0.7% return)
Median ending value: $429k (7.6% return)
Lastly, here’s how $100,000 grew over every 30-year period between 1928 and 2016:
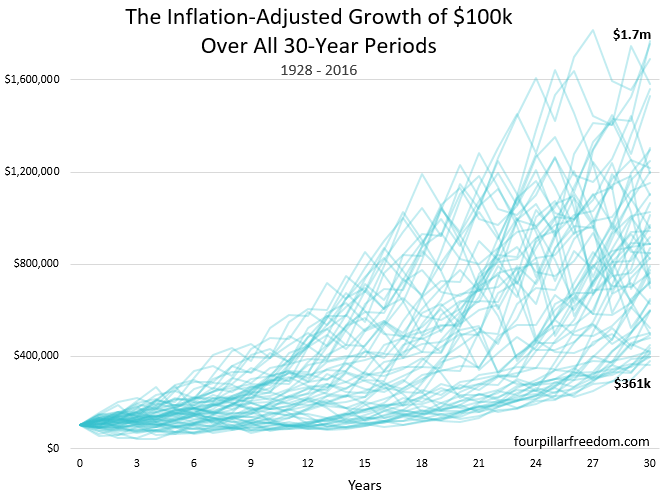
Best 30-year period (1932 – 1961) – $100k grew to $1.77 million (10% returns)
Worst 30-year period (1965 – 1994) – $100k grew to 361k (4.4% return)
Median ending value: $824k (7.3% return)
What About Different Time Horizons?
Here’s a look at the inflation-adjusted S&P 500 returns over different time horizons:
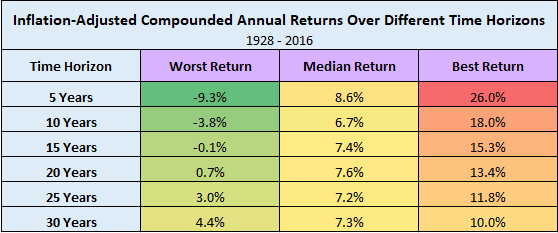
Some interesting observations:
1. The longer the time horizon, the less extreme the worst and best returns become.
2. 20-year time horizons and longer have never seen negative compounded annual returns.
3. Anything can happen during a short 5-year time horizon. Your savings could get crushed (-9.3% returns) or blossom (26% returns). This is why it’s risky to invest money you might need in the short-term (<5 years).
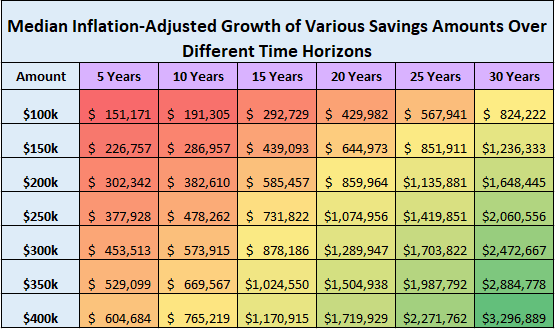
Given these numbers, here’s how different savings amounts would have grown over different time horizons…
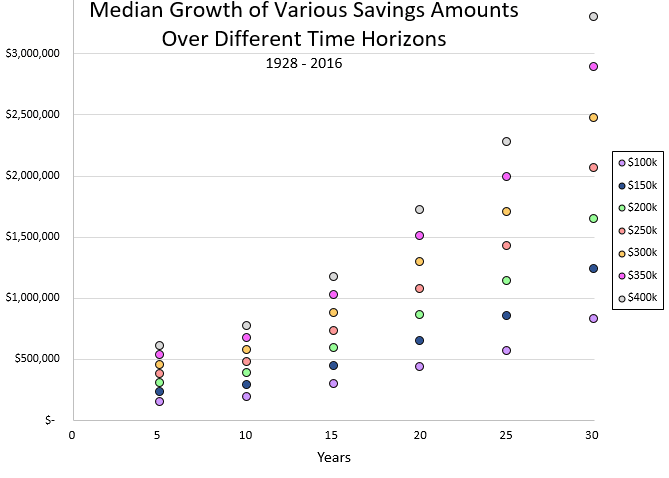
…along with a graph to visualize these numbers:
Why This Matters
To me, this analysis is relevant for anyone who is considering “retiring” before they save up 25 times their annual expenses. I think there’s a sizable amount of people out there who like the idea of saving 50% + of their income, but don’t love the idea of doing so for 10 – 15 years to achieve F.I.
For these people, it’s good to know how you can expect your investments to grow if you stop contributing additional money. This analysis ultimately shows that in the short-term (<5 years), it’s incredibly hard to predict how your investments will grow. The longer your time horizon, i.e. the longer you let your investments sit, the more confident you can be that your ending savings amount will be worth more than your original amount.
An example of someone who this analysis could be relevant for: A 30-year old who just discovered the early retirement community and earns a decent income, but has very little savings. Instead of working until 45 to achieve F.I. they may instead opt to save $200k by age 35, then quit their job to earn money doing something they enjoy, while letting that $200k sit for the next 15 – 20 years without touching it.
When they do need to access those savings, they can expect it to be worth around $500k – $1 million depending on their returns. This route allows them to quit their job 10 years early and still have a decent chunk of cash waiting for them when they’re older.
I should mention a few caveats:
1. Historical returns are no guarantee of future returns. Given the recent bull market we have experienced (2009 – 2018), it’s entirely possible that future returns could be lower than what we have seen in the past.
2. A portfolio with more bonds in the mix would have provided less volatile returns.
3. This analysis assumes you add no additional contributions to your savings. This may or may not be realistic depending on what type of income you earn after retiring.
4. This route isn’t for everyone, but it provides a possible alternative to the “25 times savings” approach.
- The Ad Revenue Grid - August 6, 2021
- Attract Money by Creating Value for a Specific Audience - July 13, 2021
- The 5-Hour Workday - March 26, 2021
Full Disclosure: Nothing on this site should ever be considered to be advice, research or an invitation to buy or sell any securities, please see my Terms & Conditions page for a full disclaimer.

This sort of strategy definitely has appeal to me, so it’s nice to see some numbers. I’ve only run some very basic calculations, so I appreciated the historical returns analysis. I think you do a good job of explaining that this is the sort of calculation that gives a rough idea of what’s possible, rather than a defined expectation of what we’ll see. For me, at least, it makes it clear that such a strategy could work.
You’re not alone – I think this is a viable path many people could pursue as opposed to complete financial independence. Of course it’s a bit riskier, but the payoff is time and it’s tough to put a price on time.
I like the simplicity of the analysis. Will you be doing one for STI ETF? You mentioned adding bonds into the picture, just wondering how would adding ABF Singapore Bond Index ETF affect your analysis of 25 times annual spending. Would be good if you could break down your analysis so we could come up with our own based on our own make ups.
Hey Skye, at this time I don’t plan on doing an analysis with STI, but I do hope to clean up my excel sheet and share it so people can plug in their own numbers / own ETF’s.
This post is so motivating! When I first discovered FI, I actually got a little discouraged after learning I needed to save up at least 25 times my annual expenses. That number seemed (and still seems) so far away! But your post shows that you don’t necessarily have to wait until you achieve that number. I’m definitely considering this approach to achieve FI.
Agreed! 25x expenses is a good point to reach if you NEVER want to work again, but for those of us who would like to do some type of work, 25x expenses is a bit overkill.