
5 min read
NOTE: This analysis has been modified to include inflation-adjusted results. Thank you to Physician on Fire, Early Retirement Now, Steveark, and Mr. Tako for suggesting this modification in the comment section, as well as Michael Kitces who provided feedback via Twitter.
Almost all retirement number calculations are based on the 4% Rule, which originated from the Trinity Study. This rule states that once you save up 25 times your annual expenses, you can retire and “safely” withdraw 4% of your portfolio each year with a high likelihood that you’ll never run out of money.
The study states,
“If history is any guide for the future, then withdrawal rates of 3% and 4% are extremely unlikely to exhaust any portfolio of stocks and bonds during any of the payout periods … In those cases, portfolio success seems close to being assured.“
This study is like the bible of the early retirement community. Ask anyone in the community, “how much should I save for retirement?”
You’ll get the response, “25 times your annual expenses.”
The Trinity Study provides the research to support that answer. It’s a great study, but I have a couple gripes with it.
The Trinity Study only looks at 15 – 30 year retirement periods. It seems that more and more people are reaching early retirement between ages 30 – 45. A huge portion of these people can expect to be retired anywhere from 30 – 50 years.
The study assumes a portfolio is “successful” if it has at least 1 dollar left at the end of the 30-year time period. I’d like to see just how much the portfolio is worth at the end of the 30 years, not just whether or not it was “successful.”
The study only uses data from 1925 – 1995. I’d like to see more recent data included in the analysis.
I’d like to present my own modified analysis that addresses each of these points. Using data from 1928 to 2016, I analyze exactly how much a “25 times expenses” portfolio is worth at the end of every 10, 20, 30, 40, and 50-year retirement period.
Let’s have a look!
The Analysis
Unlike the Trinity Study, I don’t analyze different stock/bond portfolio mixes. Instead, I assume that all of one’s savings are invested in the S&P 500. I use historical S&P 500 returns from this page and yearly inflation rates from Rober Schiller’s historical data.
First, let’s see how the “25 times expenses” portfolio has done historically. For all of the following charts, I assume that the starting portfolio is 25 times the size of one’s yearly expenses, that one spends 4% of their starting portfolio value each year, and that spending increases with inflation each year.
For example, if you spend $40,000 per year, your starting portfolio value is $1 million. Each year you have your entire portfolio invested in the S&P 500. In year one you spend $40,000 and each year your spending increases based on the historical inflation rate.
The following chart shows the ending value of this type of portfolio during every 30-year retirement period from 1928 to 2016.
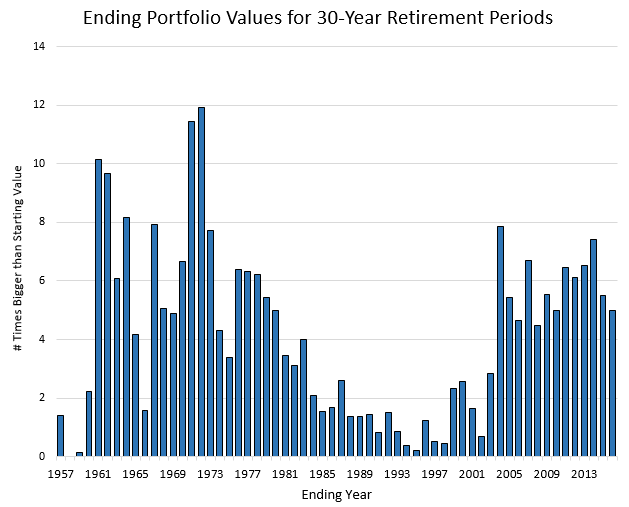
An example of how to interpret this chart: If you retired in 1932 with one million dollars, kept all of it invested in the S&P 500, spent $40k in year one and increased spending to keep up with inflation each year, thirty years later in 1961 that portfolio would be worth just over 10 times it’s original amount.
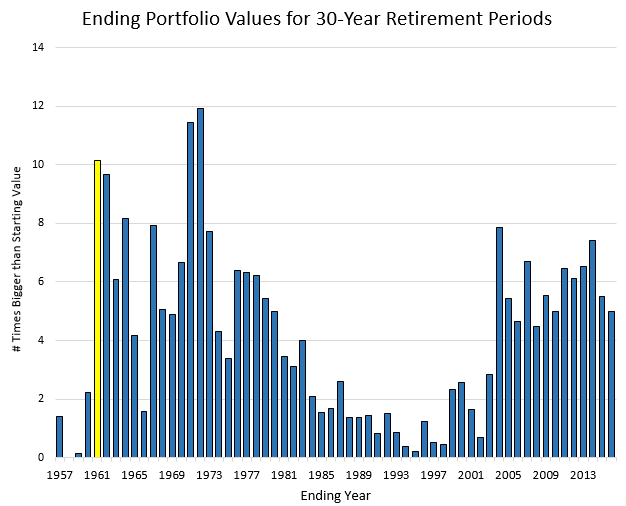
When I first saw this result, I stopped to double check my math. Could a portfolio really be worth ten times it’s original amount in 30 years, even when you’re using money from that portfolio to live on? It turns out that yes, my calculations were correct, and I simply underestimated how powerful compound interest could truly be.
Here’s the exact growth of that $1 million portfolio during this 1932 – 1961 time period:
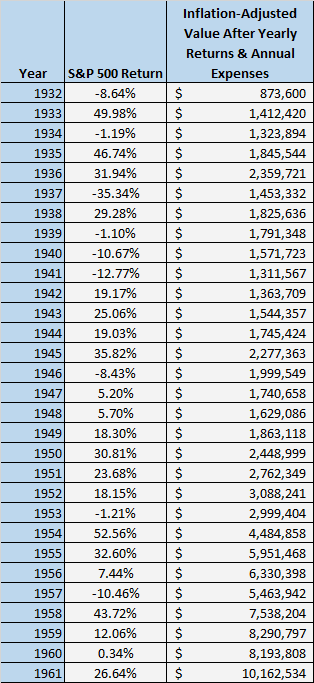
That’s incredible. The original $1 million actually was worth over 10 times it’s original amount, even after using the portfolio to support one’s living expenses.
It turns out that this type of portfolio had a positive ending value in 59 out of the 60 30-year periods. Not only that, but 2/3rds of the time the portfolio ending value was more than double the starting value.
It also turns out that the median ending value for the portfolios that did survive was 4.2 times the size of the starting value. This means a $1 million portfolio was typically worth $4,200,000 thirty years later.
Side note: These calculations work for any level of spending. For example, for someone who retires with $500,000 and only spends $20k per year, their portfolio would also have been worth 4.2 times the size of it’s starting value thirty years later.
Next, I looked at how this type of portfolio did over different time periods. This portfolio did well over most 30-year periods, but how did it perform over every 10, 20, 40, and 50-year period from 1928 – 2016?
Here are the results:
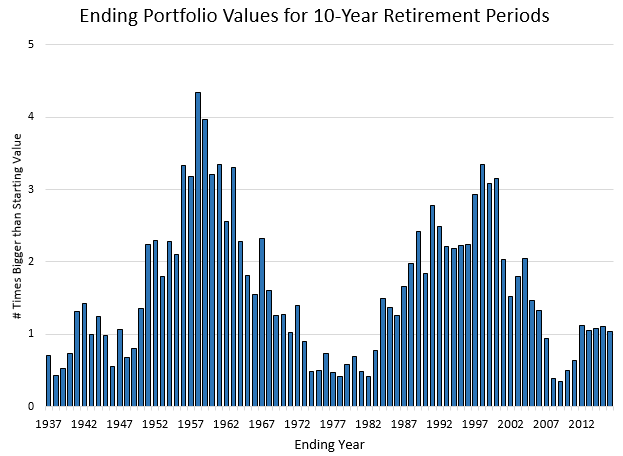
Number of periods portfolio ended with positive value: 100% (80 out of 80)
Median ending portfolio value: 1.38 times bigger than starting value
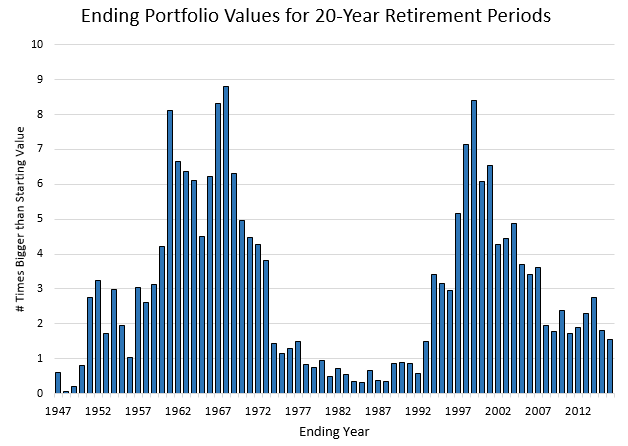
Number of periods portfolio ended with positive value: 100% (70 out of 70)
Median ending portfolio value: 2.50 times bigger than starting value
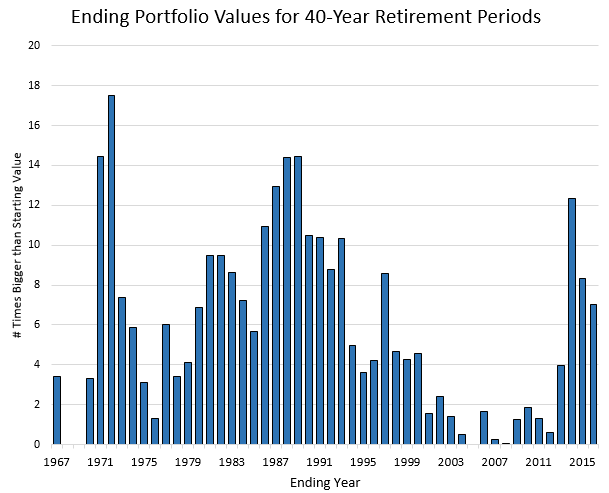
Number of years portfolio ended with positive value: 94% (47 out of 50)
Median ending portfolio value: 4.62 times bigger than starting value
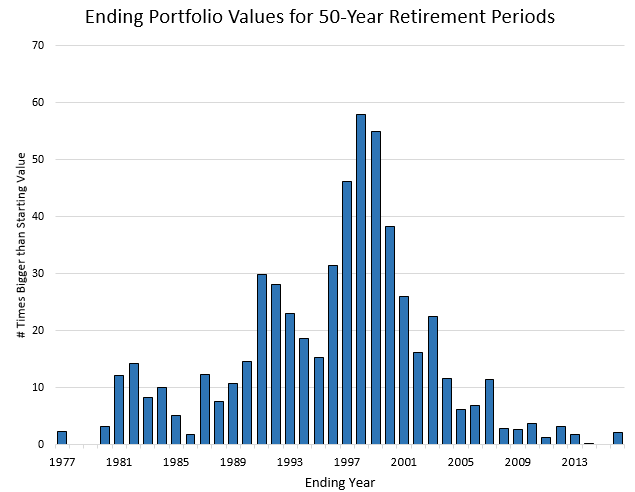
Number of years portfolio ended with positive value: 92% (37 out of 40)
Median ending portfolio value: 10.39 times bigger than starting value
Here are the aggregated results:
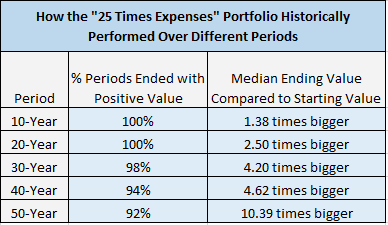
It turns out the “25 times expenses” portfolio has not only performed well over 30-year periods, but it has done incredibly well over 40-year and 50-year periods as well.
It’s pretty insane how large the portfolio can become if it does survive 40 and 50-year stretches. The average portfolio value at the end of 50 years is over 10 times bigger than the starting value. That means a $1 million portfolio has, on average, grown to $10 million over historical 50-year periods. This is good news for people looking to retire in their 30’s who will potentially face a 50 + year retirement.
Closing Remarks
Historical stock market returns are no guarantee of future returns, but they do provide a nice reference point.
It turns out that saving 25 times your annual expenses has historically provided a powerful portfolio that usually survived for decades. The only portfolios that didn’t survive in the past are the ones that experienced consecutive early years of awful returns. Specifically, the returns during the Great Depression from 1929 – 1931 were enough to wipe out “25 times expenses” portfolios.
There are two points of this analysis I want to explore even further in a different post:
1. The “25 times expenses” portfolio has done so well historically, it begs the question: how have smaller portfolios performed? How do “15 times expenses” or even “10 times expenses” portfolios perform? Do they survive over long periods of time?
2. This analysis assumes you earn zero dollars in income after your retire. How does part-time work during retirement impact these calculations? Specifically, how much sooner could you actually retire if you incorporate some part-time work into your post-retirement life?
Stay tuned for a future analysis where I explore these questions in-depth.
- The Ad Revenue Grid - August 6, 2021
- Attract Money by Creating Value for a Specific Audience - July 13, 2021
- The 5-Hour Workday - March 26, 2021
Full Disclosure: Nothing on this site should ever be considered to be advice, research or an invitation to buy or sell any securities, please see my Terms & Conditions page for a full disclaimer.

Love it! Many wannabe early retirees also feel like they can and will just reduce their spending if the markets head south (or they’ll go back to work). Based on your numbers here those backup plans are nice, but unlikely to be needed.
Amazing numbers, Zach, but I’m trying to reconcile how the numbers presented here differ so much from Kitces, who says the median outcome is 2.8x to 3.7x after 30 years. The 100% stock allocation certainly explains some of it; maybe it explains the discrepancy completely?
From “Nerd’s Eye View”: “In fact, not only do 90%+ of retirees finish with more than their starting principal after 30 years by following the 4% rule (so even if you outlive the time horizon, there’s still funds left over), the “typical” retiree actually finishes with many multiples of their starting wealth with this spending approach! Over 2/3rds of the time the retiree finishes with more-than-double their initial principal left over. And the median wealth at the end of 30 years is almost 2.8X principal! One-in-six scenarios finish with more than quintuple the retiree’s initial wealth! Since the 1920s – the “modern era” of stock investing (as illustrated by the classic Andex Charts based on Morningstar/Ibbotson data) – the odds of doubling wealth is 80% (on top of lifetime spending using the 4% rule), the median wealth at the end of the time period is 3.7X starting principal, and more than 1/3rd of retirees would have finished with over 5X their starting retirement portfolio!”[https://www.kitces.com/blog/the-ratcheting-safe-withdrawal-rate-a-more-dominant-version-of-the-4-rule/]
Solid work, and I’ll be interested in your reply.
Cheers!
-PoF
I really enjoyed this piece. Can you share the spreadsheet you created this with similar to your net worth tracker? I’m working with my folks and trying to get them setup for retirement and I’d love to show them the math. I’ve started recreating, but I think I’m misplacing an assumption.
Hey John – to be honest, the spreadsheet is messy and not user-friendly. I plan on cleaning it up and releasing it at some point. I’ll keep you posted 🙂
Nice work! I think in the previous studies they used the actual inflation rate for each year (which was double digit in some of the 70’s for instance). That would negatively impact your results quite a bit I think but assuming we never see that again then your telling me I’m going to have a lot of money to give to my decendents since my withdrawal rate is zero!
Another awesome post. Keep these kind coming. Almost no one is doing this kind of empirical analysis for the FIRE crowd. In fact, most of the FIRE people just recite the original 4% rule without realizing it was formulated with a 50/50 mix of S&P and I believe the 10 year bond, nor do they realize that it was for a 30 year period with the goal of not reaching 0 during any point in those 30 years.
Another interesting observation is the delta between ending value for scenarios just a couple of years apart. For instance, consider in the “Ending Portfolio Values for 30 Year Values” for 2001 vs 2004. Huge difference! This is what sequence of returns is all about. This means that if you get hit hard around the time of your retirement, it will create a hole that is very hard to dig out of. One answer to this is, don’t retire going into a stock market correction and if it happens early in your retirement, scale way back on spend or try to get a job so you don’t spend from the portfolio during that time, if you want to minimize the chances of a portfolio exhaustion (these are past results, no one knows if future ones will be worse than past).
You might consider posting your code on github, for public analysis to help bolster the veracity of the conclusions.
You could also talk about drawdowns/volatility of these portfolio. Finally, consider what a balanced portfolio could do to dampen the volatility vs reduced upside. Its one thing to know that if you are all in, you are going to have lows, its another thing to live through it, so showing the drawdowns could help people prepare for such.
Otherwise excellent and another rockstar finance worthy post.
Thank you! Glad you liked the post 🙂 Good point about posting the code to github – I may end up doing that so others can see the behind-the-scenes math.
I wouldn’t trust the results. The final value is in nominal dollars, i.e., not inflation adjusted. Also, the average inflation rate was higher than 2%, so you significantly underestimate the withdrawal amounts. Why not simply use the actual CPI numbers? Robert Shiller has the long time series!
Long story short, if you use the actual CPI numbers and a 4% SWR and 100% equities, I get a failure rate of around 3%. Among the cohorts that didn’t fail, the average final value was about 3.2x the starting value. Very nice but not as impressive as your 14x number.
But even the 3.2x number is not that representative because the average final value is dragged up by the retirement cohorts that retired at the bottom of the big recessions. Exactly when very few people had a large enough portfolio to retire.
I was going to point out this flaw, but you beat me to it ERN!
Other than that a nice analysis FPF!
I agree that a 2% inflation for 50 years is a very big assumption.
I’d love to see it with actual historic rates, or even just for comparison if the rate was 4%.
Also the final results should be also given a current dollar value.
Hmmm..
Am I understanding this right? 100% equity portfolio supports the 4% rule over decades?
Would you recommend the early retiree to be 100% in equities based on this?
The monte carlo calculators I’ve used point out that in the first 7 or so years of a 30 year retirement is when SORR comes up and kills you. Even 1 year starting with worst case SORR is enough to kill 10% of the portfolios before 30 years. By changing AA to 50/50 yr 1 worst SORR is over 98% successful.
At first 7 years worst case, SORR kills a 100% stock portfolio by as soon as year 6 . In other words most of the portfolios are dead before year 7 even starts. 50/50 portfolios starting with 7 years of worst SORR die but at a MUCH slower rate and 50% have almost the starting million or more at the end of 30 years.
Here is a calculator to play with
https://www.portfoliovisualizer.com/monte-carlo-simulation#analysisResults
I just used total stock and total bond as asset classes. IMHO 100% equity in early retirement is Russian roulette with a 2 shot revolver using this analyzer. Past performance is no guarantee of future results, which is why I do not trust the 4% rule.
People poo poo monte carlo analysis but then they drive across bridges every day that were built using monte carlo statistical error analysis.
That’s a great calculator – thanks for providing the link.
Hey WealthyDoc, the 25 times expenses 100% equities portfolio performs well over most multi-decade time periods, however there are periods where it has failed before. It’s rare, but it happens. In addition, the biggest danger of having a 100% equities portfolio is simply having the discipline to not sell off your equities during market crashes. Most people don’t have the guts to withstand market corrections and remain fully invested. This can be the psychological benefits of owning bonds – a less volatile ride makes most investors more likely to stick to their asset allocations.
Zach, much respect for being open to questions and suggestions from others and modifying your analysis based on what they’ve said. Being open to adjusting one’s thinking based on new information is a sign of real intellect.
Thanks, Andy – In all my analyses I care more about uncovering the true math than about being right. Sometimes other readers offer comments that improve my posts and I try to always be open-minded to these comments. In this case, they were extremely beneficial 🙂
Very interesting. For those 40 and 50 year ones, I’m surprised it’s still in the low 90% range. I’m really interested in you expanding on the ‘part time work’ concept.
I was equally surprised by those results. It seems that as long as your portfolio can withstand the first few years after retiring, it can survive almost indefinitely. I’m currently writing a follow-up post to this one, which I’ll post later this week 🙂
This is great and broken down really well. I’ve never really dived into the nitty gritty of the 4% rule and 25x expenses. I understood it a lot better from reading this. The results are good! I’m still deciding on what my “number” would even be for retiring on.
Thanks, Colin! Glad you found the analysis helpful 🙂
Nice work. The 25 x expenses and a 4% withdrawal rate held up nicely in the past. William P. Bergen created the 4% rule. You used the S&P 500 for your case study. He suggests adding a % of small caps for growth. The 4% withdrawal rate was based on a portfolio of 35% in large caps, 20% in small caps, and 45% in intermediate-term government bonds.
Great points, Dave. I used the S&P 500 for this analysis just because it made things so much more simple and I didn’t have to compile as much historical data. For most retirees, bonds will be part of their portfolios, at least for the first few years of retirement to fend off potential market downturns.
Thanks for the feedback!
Awesome breakdown!
Although I understand compound interests power, I had no idea it could actually increase your portfolio ten times it’s original amount in 30 years, assuming you saved up 25* your annual expenses & using the 4% rule.
I am definitely interested to read your findings on the 2 scenarios for those who saved 10 and 15* annual expenses!
Thanks, Sean! I wrote a follow up post that shows how “less than 25 times expenses” portfolios have performed over time, be sure to check that out!
Great charts! I knew that most retirement portfolio would work with 4% withdrawal, but the charts are great. I’m still a bit nervous because the stock market is pretty crazy lately. We’re planning to put off withdrawal for about 10 years so I’m sure we’ll be fine. At that point, I’m sure we’ll need less than 3%. I think that would improve our chance of success quite a bit.
I don’t blame you. It’s good to have more cash and less volatile investments in the first few years of retirement to fend off market crashes in those first few years. Based on most studies, if you can maintain your portfolio value in the first 5-10 years of retirement, your portfolio will survive virtually indefinitely.
Super interesting analysis! Can’t believe how missed this. All the math in the title and I thought my eyes would glaze over but this was very nicely written. So a 25x portfolio will not be able to survive another Great Depression but can weather pretty much everything else that has happened? = Yayyy!!
Exactly! These results are specifically for a portfolio invested 100% in stocks, so adding bonds/cash to the mix, especially in the first few years of retirement could increase the survival rate of a portfolio, especially when the first few years experience negative returns.
For the withdrawals at what point were they taken during the year for your analysis. Ie was it spread through the year or all at once?
The withdrawals were taken out at the beginning of the year, which makes these numbers conservative.
Good Stuff. I need to bump up my 1% withdrawal rate
Thank you!
Good analysis. A key factor when analyzing portfolio performance over multi decades using a portfolio of highest volatility (that is, 100% stocks) is to capture the “failure edge” (that is, the absolute lowest point). This failure edge can be used to determine the ‘safest’ withdrawal rate over any retirement horizon. I have done it using 50 year horizon for 100% stock portfolio in my article titled “Hacking The Retirement Calculators”. I didn’t want to put a link here but you can check it out by keyword search from the title in my site or in my Archives. I would appreciate your views on it.
Awesome, I’ll check it out!
Hi,
Two online tools have a pretty good interface for anyone wanting to do a similar analysis.
http://www.cfiresim.com
https://firecalc.com
Thanks for sharing, Todd!
Great article, I just wrote an article on how you could build your retirement plan in 60 minutes which relied on the 25 times expenses target extensively. Great to see how it was proven out and I will be linking to your study!
Awesome, thanks so much for the link! 🙂