3 min read
Yesterday I shared an interactive chart that lets you visualize potential future S&P 500 returns.
It’s a simple chart, but it’s useful for understanding how different potential price paths could impact investment returns.

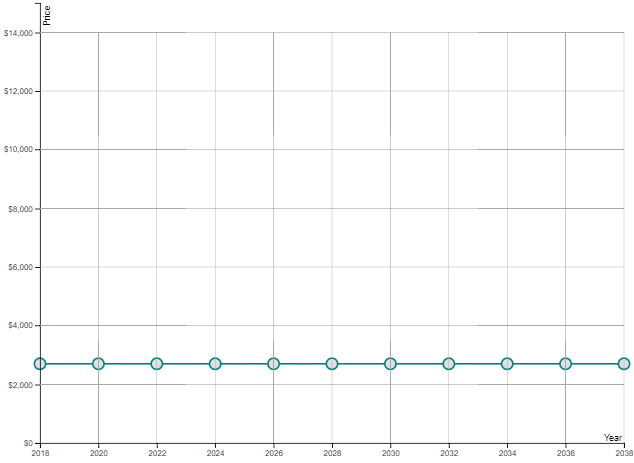
The blue line represents the price of the S&P 500 from 2018 to 2038. You can drag each circle up or down in each year to see how different price paths affect investment returns during this 20 year time period.
NOTE: The chart doesn’t account for dividends. It also assumes you follow a dollar-cost averaging strategy and invest the same amount each year in the S&P 500.
The Path to Investment Returns Matters
The following three scenarios illustrate why the path of investment returns matters. In all three, the S&P 500 has the same starting and ending prices, but drastically different paths.
Scenario 1: The Steady Increase
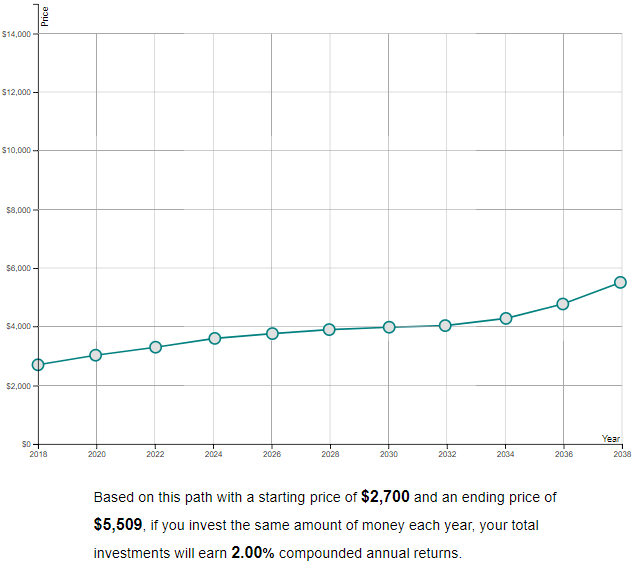
Suppose the price of the S&P 500 steadily increases each year over the next 20 years, from $2,700 at the start of 2018 to about $5,500 by 2038. If you were to invest the same amount of money each year, your average compounded annual returns would be 2%.

Scenario 2: The Crash and Recovery
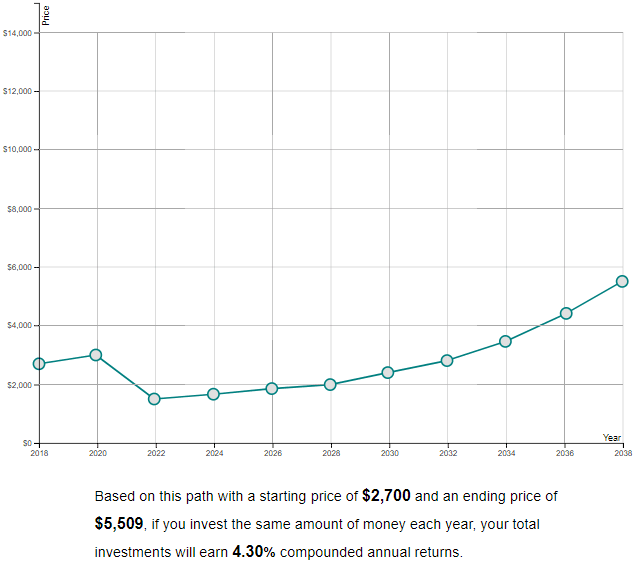
Instead, suppose the price increases to $3,000 by until 2020, only to experience a massive 50% drop to $1,500 by 2022, followed by a steady recovery to about $5,500 by 2038. In this scenario, if you invested the same amount each year, your investments would earn 4.30% average compounded annual returns.

That’s a pretty incredible difference compared to the previous scenario. In this case, a market crash within the next few years would allow investors to buy S&P 500 shares at much cheaper prices in the short-term, which would lead to higher investment returns over the long-term.
Scenario 3: The Boom and Crash
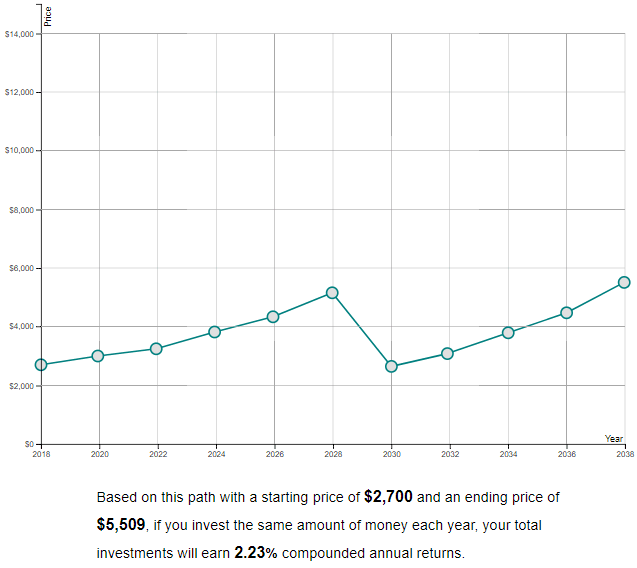
Another possible scenario could be that the S&P 500 increases steadily over the next 10 years, only to crash sharply and recover to $5,500 by 2038. In this case, investors who dollar-cost average each year would experience 2.23% average compounded annual returns.

The Big Picture
The numbers in the previous three scenarios are completely made up, but they illustrate an important point: the path to investment returns matter.
For young investors with long investment horizons, an immediate market drop would actually be the scenario that leads to the highest long-term investment returns, assuming these investors could stick to a dollar-cost averaging strategy during a market crash and keep buying while others are selling.
Conversely, the worst-case scenario for young investors would be if the market keeps rallying for several more years, only to crash a decade from now. In this case, investors would be buying S&P 500 shares at higher and higher prices, which would hurt their returns when a market crash finally does occur.
Give it a Try
Play around with the interactive chart yourself to see how different price paths could impact future investment returns. I only covered three potential scenarios here, but there are many different paths the S&P 500 could take over the next 20 years.
My favorite free financial tool I use is Personal Capital. I use it to track my net worth, manage my spending, and keep an eye on my monthly cash flow. It only takes a few minutes to set up and it makes tracking your finances simple and easy. I recommend trying it out.
You can also sign up to have my most recent articles sent straight to your email inbox for free ?
[jetpack_subscription_form subscribe_text = “” title=””]
- The Ad Revenue Grid - August 6, 2021
- Attract Money by Creating Value for a Specific Audience - July 13, 2021
- The 5-Hour Workday - March 26, 2021
Full Disclosure: Nothing on this site should ever be considered to be advice, research or an invitation to buy or sell any securities, please see my Terms & Conditions page for a full disclaimer.

Unfortunately, we neither get to decide nor know the future path to investment returns in reality. However, what we can do is to hope for the best and prepare for the worst. In the worst case scenario (market rallying for several years and only crashing near F.I/retirement), I propose that the investor concentrate on what he can control e.g. contributing more to the portfolio especially during the early years to compensate for the lower return, and increasing the proportion of bonds in the portfolio as he or she approaches FI/retirement to mitigate the impact of the market crash. What do you think? 🙂
You’re right, it’s impossible to predict what the future path of the market can be. I agree with your points – focus on increasing your savings rate so you simply have more money to invest, and as you approach your F.I. number potentially consider investing more in bonds, depending on what your plans are for income following F.I. Some people will be fine with a higher equity allocation if they have some type of enjoyable part-time work to bring in additional income. In general, focus on maintaining a high savings rate and let the market do whatever it may 🙂
Let’s go market drop!
I finally feel like in my late 20’s I have the big ticket items out of the way. Married, house, paid off cars. While I am working hard and stable it would be awesome to see a pull back!
That’s awesome you have all those big ticket items out of the way! A pullback would be an awesome opportunity for you to dump some savings into the market and experience higher returns over time. We’ll see what happens! 🙂