
A 401(k) is a retirement savings plan offered by most employers to employees. It lets employees save and invest part of their paycheck before taxes are taken out. The max an employee can contribute to a 401(k) will now be $18,500 starting in 2018, a nice little bump up from the previous max of $18,000.
I want to illustrate how much a 401(k) can impact overall savings rate, using my last two paychecks as an example.
This month I finally became eligible to contribute to my 401(k) plan at my new job and I elected to contribute $650 of my total paycheck to it. To see just how much of a difference this makes, here is my paycheck from two weeks ago without any 401(k) contribution:
| My Paycheck Without Any 401(k) Contribution | |
| Gross Pay | $3,120 |
| Social Security | $193 |
| Medicare | $45 |
| Federal Tax | $477 |
| State Tax | $100 |
| Local Tax | $39 |
| 401(k) Contribution | $0 |
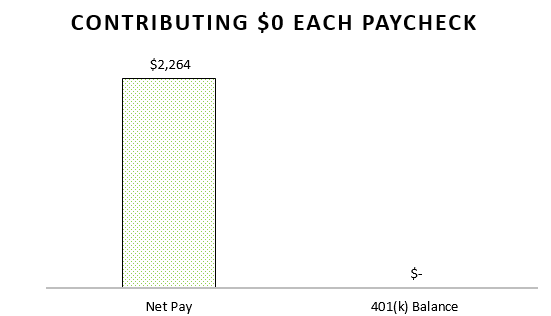
| Net Pay | $2,264 |
| Total Amount of Gross Pay I Kept | $2,264 (72.5% of gross pay) |
My total gross pay was $3,120, but after paying Social Security, Medicare, and all the different levels of federal, state, and local taxes, I was left with $2,264. I kept 72.5% of my total gross pay. It’s pretty incredible to see that over a fourth of my time spent working in my cubicle was solely me working to pay taxes.
Now here is my most recent paycheck with a 401(k) contribution:
| My Paycheck With a 401(k) Contribution | |
| Gross Pay | $3,120 |
| Social Security | $193 |
| Medicare | $45 |
| Federal Tax | $314 |
| State Tax | $74 |
| Local Tax | $39 |
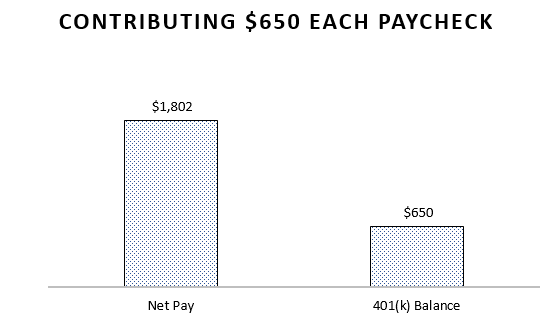
| 401(k) Contribution | $650 |
| Net Pay | $1,802 |
| Total Amount of Gross Pay I Kept | $2,452 (78.5% of gross pay) |
By contributing $650 from my two-week paycheck to my 401(k) plan, I was able to significantly reduce my federal and state taxes and keep 78.5% of my total gross pay. None of the $650 I saved was taxed at all. It simply bypassed the tax man altogether and jumped safely into my S&P 500 fund in my 401(k) plan.
Now let’s visualize the dramatic difference between contributing $650 each paycheck compared to not contributing at all.
Here’s what my paychecks look like if I contribute $0 to my 401(k) plan every two weeks:
And if I keep this pattern up for one year:
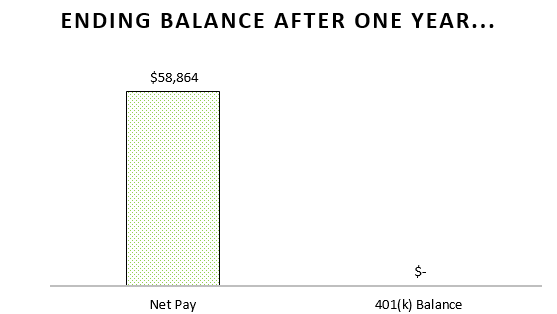
I would retain a total of $58,864.
Here’s what my paychecks look like if I contribute $650 to my 401(k) plan every two weeks:
And if I keep up this pattern for a year:
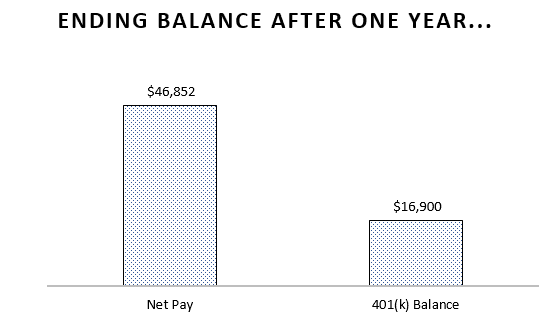
I would retain a total of $63,752. That’s a difference of $4,888.
Maybe $4,888 doesn’t sound like much, but here’s what an extra $4,888 can become if it’s invested for 20 years at a 7% interest rate:
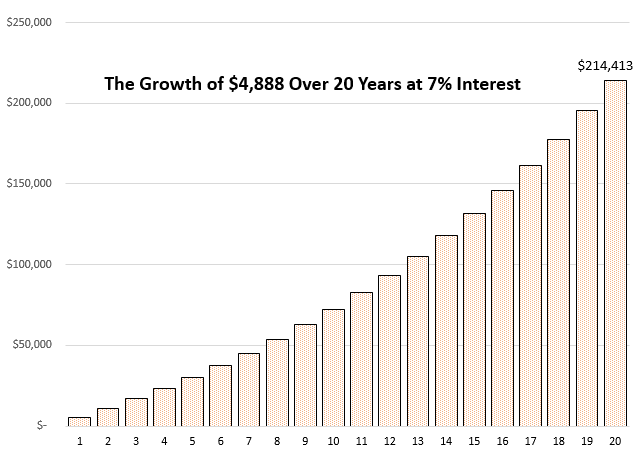
That’s over $214,000 in 20 years.
If you’re looking to improve your financial situation, increase your savings rate, and pay less in taxes, look for ways to contribute more to your 401(k) plan each year. The long-term impact of steady savings is incredible.
Happy saving! 🙂
- The Ad Revenue Grid - August 6, 2021
- Attract Money by Creating Value for a Specific Audience - July 13, 2021
- The 5-Hour Workday - March 26, 2021
Full Disclosure: Nothing on this site should ever be considered to be advice, research or an invitation to buy or sell any securities, please see my Terms & Conditions page for a full disclaimer.

Love all the charts! Thankfully even when I was making starting salaries, I still contributed 15% to my 401k. I kept increasing it as my salaries went up, too. It’s super neat to watch the balances grow.
What did you use to calculate the paychecks w/without the 401k contributions?
Thanks, Luxe! I like to think the charts add some extra context to illustrate my points. And 15% is great for a starting salary, that’s considerably higher than most people contribute when they’re just starting out. Also, I just copy and pasted my paycheck info from my employer online into Microsoft Excel and did some simple calculations there 🙂
This is great! I’m sharing it with friends and family. Can you do a similar analysis on a Health Savings Plan?
Thanks for sharing, John! I’ll look into doing a similar post for a Health Savings Plan in the future. That’s another great way to save tax-free money – thanks for the idea 🙂
We pay so much in taxes as it is. Nice to use our own money to help us and in the process reduce taxes. Also let’s get our bang for our tax bucks and do things like visit libraries, free museums, and exhibits more often. We are paying for them via taxes, right? 🙂
That’s exactly right. It’s a little mind-boggling to realize how much you actually pay in taxes when you consider federal, state, local, etc. It really adds up. That’s why it’s so important to keep as much money as possible tax-sheltered.
The visual charts really help bring the point home. Good job! As soon as I finish paying off my student loans in the next few months I’ll be bumping up my 401k contribution. There’s a small typo on this sentence before showing the chart you contribute $650:
“Here’s what my paychecks look like if I contribute $0 to my 401(k) plan every two weeks:”
The “$0” is missing the “65” in front 🙂
Thanks, Johan! And cheers to paying off your loans and increasing your 401(k) contribution. That will give a nice boost to your savings rate. Also thanks for pointing out that error, I just fixed it 🙂
Great stuff Zach! What do you think is a good benchmark for percentage of gross income to save/invest for young adults just starting out? I’d like to say at least 20%. If you’re not at least at 20% chances are you not challenging your lifestyle decision enough. Thoughts?
I think 20% is a great target savings rate for young people just starting out, although it’s not always possible to save that much due to student loans and lower-paying jobs right out of college. The most important thing isn’t necessarily how much you save starting out, but how much you increase it by over time. Even if you’re only able to save 10% of your gross income, if you’re able to increase that number to 15%, then 20%, 25%, etc. as time goes on, you’ll be in great shape.