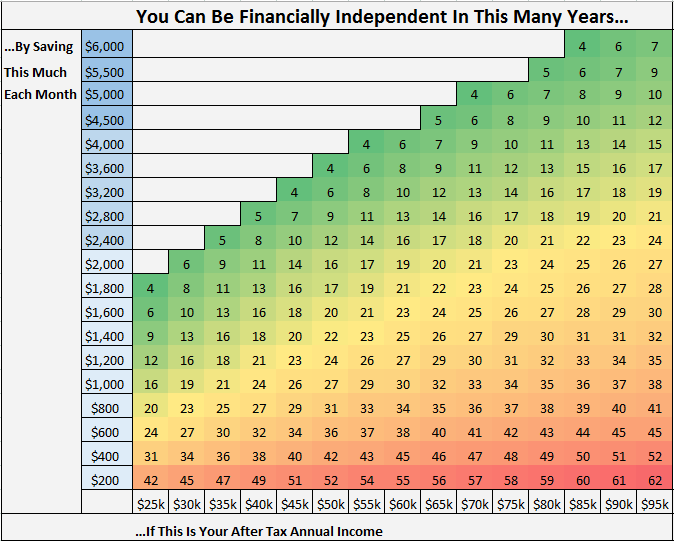
Behold. The Monthly Savings Grid.
This grid shows how many years it will take you to reach financial independence based on your after tax annual income and how much you save per month.
This grid assumes you start with a net worth of $0 and that your savings are invested and will grow at a rate of 7% annually.
Here’s how to interpret this grid
If you make $25,000 per year (after taxes) and you save $200 per month, you will be financially independent in 42 years.
Here’s the math behind it:
If you make $25,000 per year and save $200 per month, this means you’re saving $2,400 per year and spending $22,600 per year. You need 25 times your annual spending to be financially independent, which is 25 * 22,600 = $565,000.
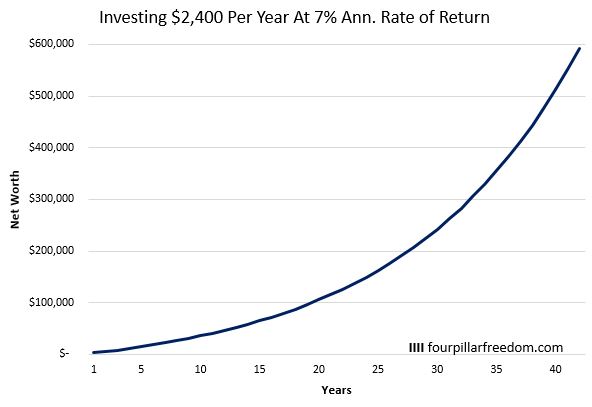
By saving and investing $2,400 per year ($200 each month) at a 7% annual rate of return you will cross your mark of $565,000 in 42 years:


Some Interesting Observations
- Increasing monthly savings from $200 to $400 at every income level allows you to reach financial independence at least ten years sooner.
- The light green boxes represent about a 50% savings rate while the dark green boxes are closer to a 65 – 80% savings rate.
- Someone who starts working in their early 20’s and makes $50k per year (after taxes) can retire in their late forties by saving and investing just $1,000 per month.
- That same person who starts working in their early 20’s and makes $50k per year (after taxes) can retire in their mid to late thirties by saving and investing $2,000 per month.
Related: The Million Dollar Age Grid
- The Ad Revenue Grid - August 6, 2021
- Attract Money by Creating Value for a Specific Audience - July 13, 2021
- The 5-Hour Workday - March 26, 2021
Full Disclosure: Nothing on this site should ever be considered to be advice, research or an invitation to buy or sell any securities, please see my Terms & Conditions page for a full disclaimer.

Wow, this is a great graph! I find it fascinating that the $200 to $400 savings bump in each bracket cuts off at least 10 years. Thank you for sharing!
Our savings rate hovers around 40 – 50% right now, but I know it’ll be even better once we’re able to eliminate our mortgage. 🙂 This also assumes that you aren’t paying off debt and all of our savings are going directly into *savings* or investments. So if you have debt, you’re paused before you can really use this chart to calculate your FIRE date.
Awesome grid! What if you don’t start at zero. How can i use this and take my existing savings/retirement funds and calculate from there as the baseline?
This grid assumes you start at $0, so unfortunately it doesn’t have the ability to take into account your existing savings…but that may be a good idea for a future grid 🙂
Looking forward to it 🙂
Thanks! This gives me some clarity. Looking forward to saving more 😉
The grid is assuming 7% return on investment. If the updated grid is able to recalculate numbers based on increment of every 0.5% interest rate, it will be helpful to understand what type of investment pattern one can choose amongst 4-6 different portfolios.
I completely agree, a grid that can display numbers based on varying interest rates would be extremely helpful…I’m actually working on building an application that does that. Stay tuned 🙂
Look forward to seeing that. It is fairly unrealistic to count on a 7% return, unless you are willing to accept exposing a significant % of your portfolio to large downside risk.
I wouldn’t say a 7% annual return is completely unrealistic. Historically stocks have delivered 7% returns even after inflation. Granted, going forward most people expect annual returns to be closer to 4-6%, so it’s certainly possible that the 7% assumption is slightly lofty. The future is hard to predict though.
I assume 8% in my retirement charts. I invest very aggressively. I see no point in putting money in bonds or money markets unless I think I have enough to retire.
Sure the market is going to tank, its also going to recover.
If you think the market is going to tank and never recover than the world is likely in some sort of apocalypse and retirement will be the least of your worries.
Let it Ride !!!
I don’t understand how the higher monthly amounts are accurate. For the first column if you saved the highest figure of $1,800 per month that would total $86,400 after 4 years. Even including a 7% interest rate on top of that does not seem to get you anywhere near the $565,000 figure you say you would need. What am I missing? 🙂
It also depends on the x-axis, which shows your annual income. If you save $1,800 per month, that’s $21,600 per year. If your income was only $25k per year, that means you’d be living on $3,400. Thus, having $86,400 after 4 years would make you financially independent. Granted, it’s basically impossible to live on $3,400 per year, so the extremely low numbers on the grid are basically only mathematically sound, not realistic for most. The numbers begin to become more realistic for 8+ years
Thank you Zach. I was not understanding that it was 25 times what you were spending rather than 25 times your annual after tax income.