
4 min read
Each stock in the S&P 500 can be classified into one of eleven sectors:
- Energy (Exxon Mobile, Chevron, etc.)
- Utilities (Duke Energy, Southern Co., etc.)
- Real Estate (American Tower, Public Storage, etc.)
- Healthcare (Johnson & Johnson, Pfizer, etc.)
- Financials (JPMorgan Chase, Wells Fargo, etc.)
- Industrials (Boeing, Honeywell, etc.)
- Consumer Staples (Procter & Gamble, Walmart, etc.)
- Materials (DowDuPont, Sherwin-Williams, etc.)
- Information Technology (Apple, Microsoft, etc.)
- Communication Services (Verizon, Comcast, etc.)
- Consumer Discretionary (Amazon, Home Depot, etc.)
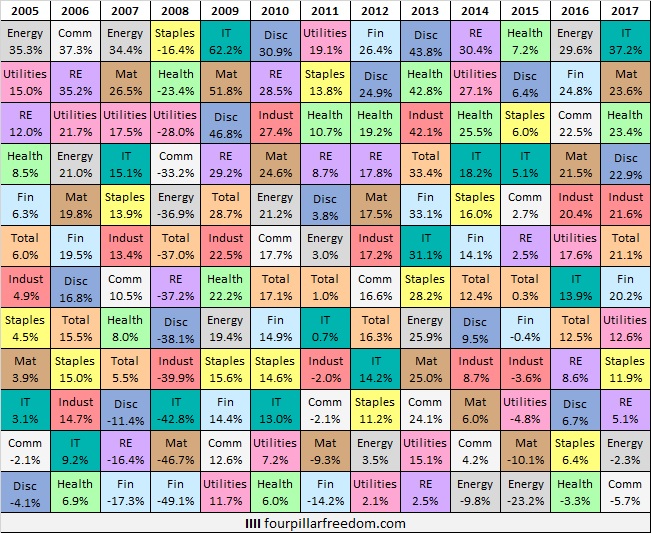
Here are the annual returns for each sector since 2005, sorted from best to worst returns by year:
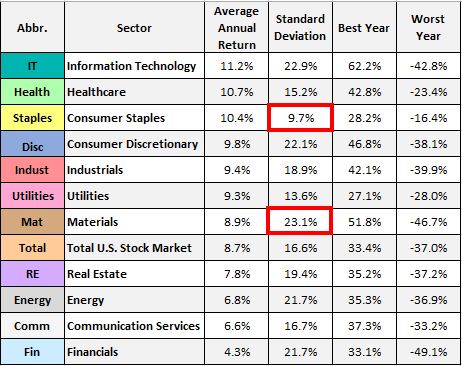
Here’s a summary of the annual returns by sector:
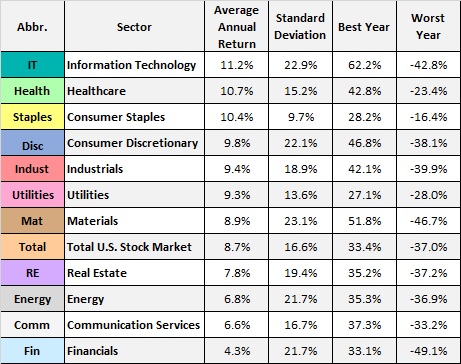
The information technology sector experienced 11.2% annual returns since 2005, the highest of any sector. The financials sector experienced 4.3% annual returns, the lowest of any sector, mostly due to the massive drawdown during the financial crisis in 2007-2008.
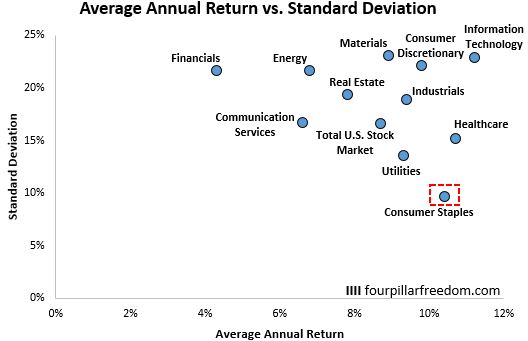
This scatterplot shows the average annual return vs. standard deviation for each sector:
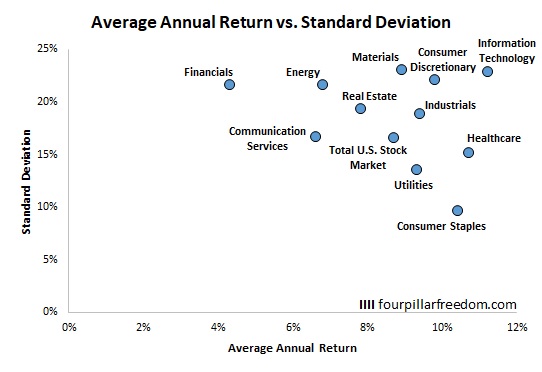
The standard deviation simply measures how volatile the annual returns were for each sector.
From this chart we can see that the information technology sector had the highest returns and nearly the highest volatility as well. Conversely, the consumer staples sector delivered the third highest annual returns of any sector, and did so with the least volatility.
This chart shows how a $100,000 investment in each sector would have grown since 2005:
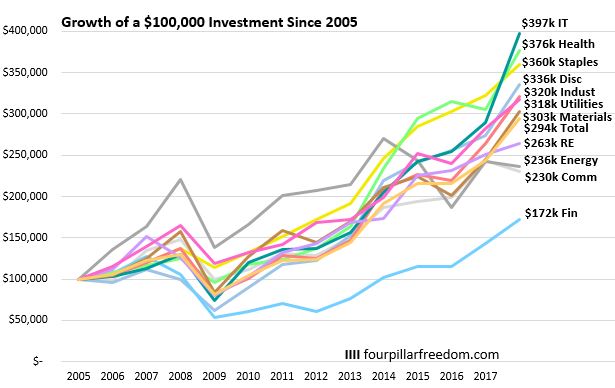
On the high end, a $100,000 investment in the information technology sector would have nearly quadrupled in value to $397,000. On the low end, a $100,000 investment in the financials sector would have failed to even double in value, only growing to $172,000.
Some Interesting Observations
Financials experienced the worst year of any sector in with a loss of 49.1% in 2008. Information technology experienced the best year of any sector with a gain of 62.2% in 2009.
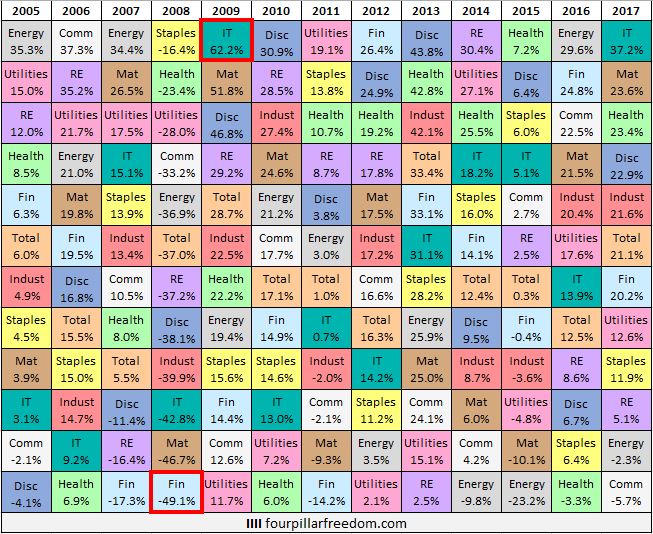
Materials was the most volatile sector during this time period with a standard deviation of 23.1%. Consumer staples was the least volatile sector with a standard deviation of just 9.7%.
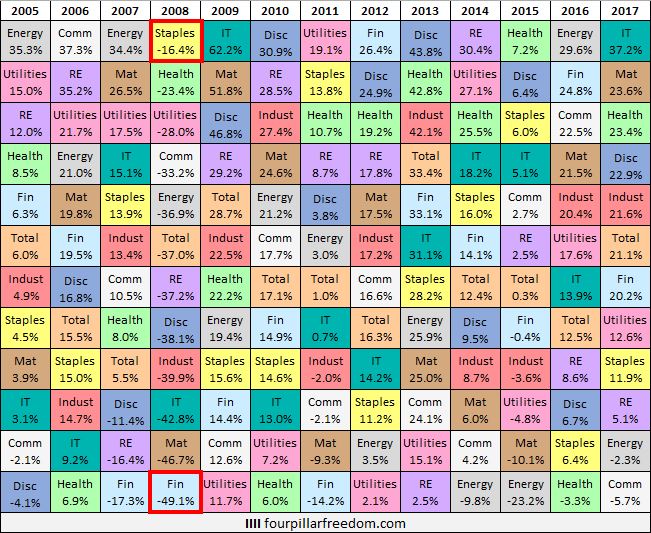
During the crash of 2008, Consumer staples dropped the least (-16.4%) and Financials dropped the most (-49.1%).
Industrials and Materials were the only two sectors to never have the highest returns in a given year.
Healthcare and Consumer Staples were the only two sectors that never dropped more than 25% in any year during this time period.
Consumer Staples only experienced one negative year.
Consumer Staples was the golden child during this time period – it delivered higher returns than every sector except IT and healthcare, and it did so with significantly lower volatility than any other sector.
Thanks for reading 🙂
Download the Excel Genius Toolkit to learn how to make charts like the ones in this post.
- The Ad Revenue Grid - August 6, 2021
- Attract Money by Creating Value for a Specific Audience - July 13, 2021
- The 5-Hour Workday - March 26, 2021
Full Disclosure: Nothing on this site should ever be considered to be advice, research or an invitation to buy or sell any securities, please see my Terms & Conditions page for a full disclaimer.

Interesting to see no sector has lost out over the investment horizon and even the worst increased 70%!
Very true! Just goes to show that most investments in equities increase over the long-term as long as you don’t touch them.