
5 min read
Here’s a fun thought experiment: Can the previous decade of stock market returns predict the upcoming decade of returns?
For example, if we know the stock market performed lousy during the previous ten years, can we expect it to perform much better over the coming 10 years to make up for the lackluster returns in prior years?
Likewise, if the market crushed it during the previous ten years, is it more likely to perform poorly over the coming 10 years?
To answer these questions, I downloaded the inflation-adjusted S&P 500 annual returns dating back to 1928 and crunched the numbers.
Can Historical Returns Predict Future Returns?
Here’s a look at the S&P 500 inflation-adjusted returns for each year since 1928:

Next, here’s a look at the annualized return for the previous 10 years along with the annualized return for the upcoming 10 years, for each year since 1938:

How to interpret this table: Suppose it is 2009. Looking back on the previous 10 years, you can see that the S&P 500 returned an average of -3.8% per year. You don’t know it at the time, but the S&P 500 will return an average of 11.0% per year for the upcoming 10 years.
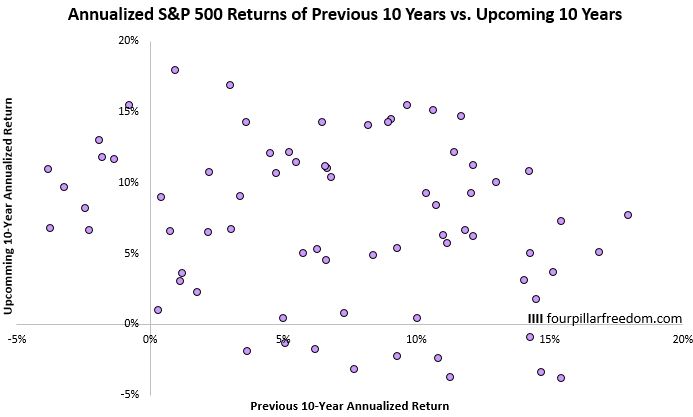
So, how well does the performance from the previous 10 years predict the performance for the upcoming 10 years?
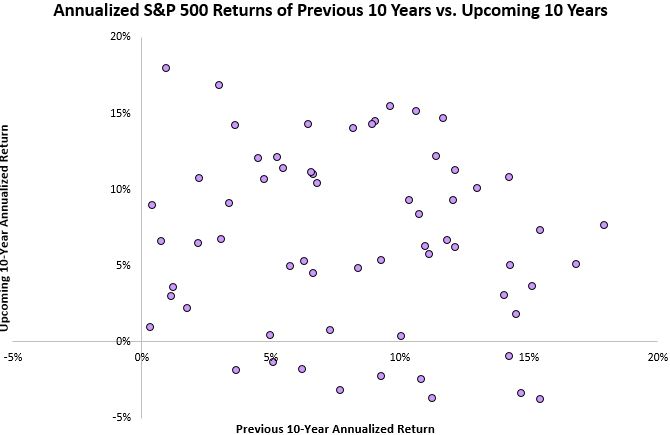
To answer this, it helps to visualize these numbers. In the following scatterplot, each circle represents a year. For each circle, we can see the previous 10-year annualized return on the x-axis along with the upcoming 10-year annualized return on the y-axis:
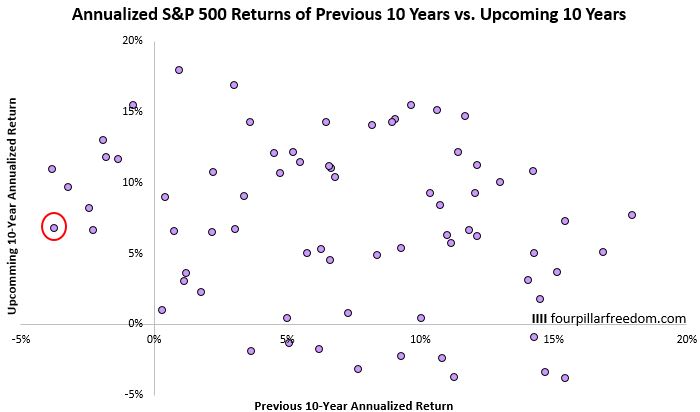
For example, the highlighted circle below represents the year 1975. In the ten years before 1975, the S&P 500 returned an average of -3.7%. In the next ten years, starting in 1975, the S&P 500 returned an average of 6.8%.
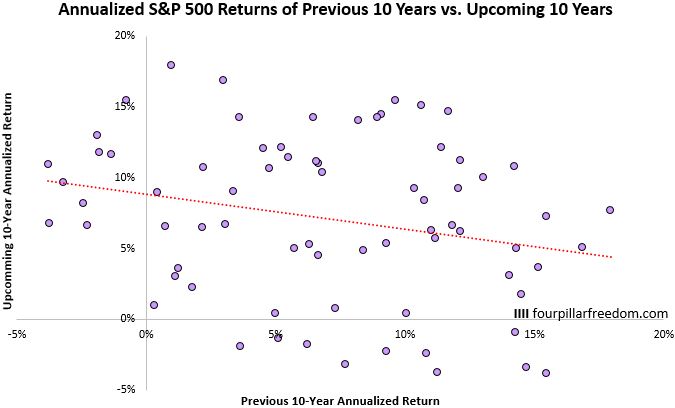
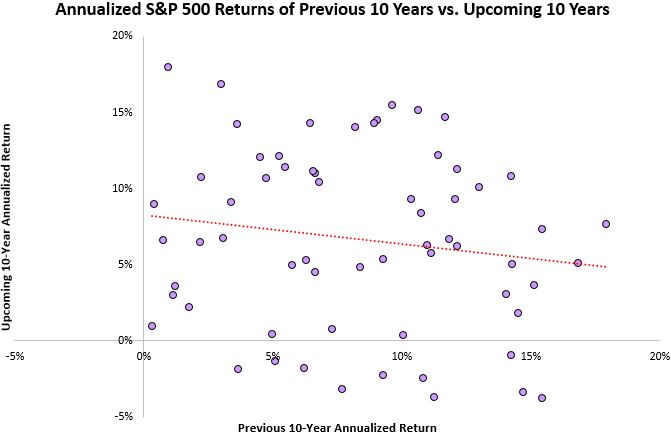
From this plot, we can see there is a downward trend. Higher previous 10-year annualized returns tend to be correlated with lower upcoming 10-year annualized returns. In statistical terms, the correlation between the previous 10-year returns and the upcoming 10-year returns is -0.25.
Negative Previous 10-Year Returns: A Good Sign for the Future
From the scatterplot we can see that there were nine distinct times when the S&P 500 returned negative annualized returns during a 10-year period. The good news is that the S&P 500 returned highly positive returns during the 10 years following each of these periods:
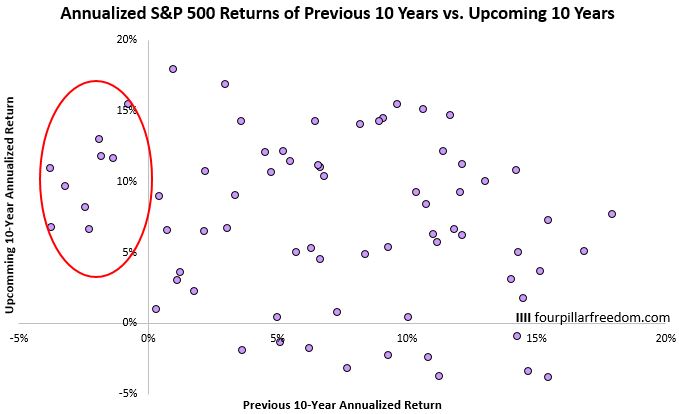
Specifically, the average upcoming 10-year annualized returns for these periods was 10.5%.
This isn’t terribly surprising. Since the stock market generally increases over time, it’s pretty likely that the market will perform well following a decade of negative returns to get back to its long-term average.
Positive Previous 10-Year Returns: An Unpredictable Future
So, when the market delivers negative returns during the previous 10 years, we can be pretty confident that it will deliver positive returns in the following 10 years.
However, when the market delivers positive returns during the previous 10 years, it’s a bit harder to predict how it will perform over the following 10 years. For example, consider the scatterplot with all of the negative previous 10-year returns removed:
The correlation between the previous 10-year returns and the upcoming 10-year returns drops to -0.15. Higher previous 10-year returns are still associated with lower upcoming 10-year returns, but the correlation is weaker.
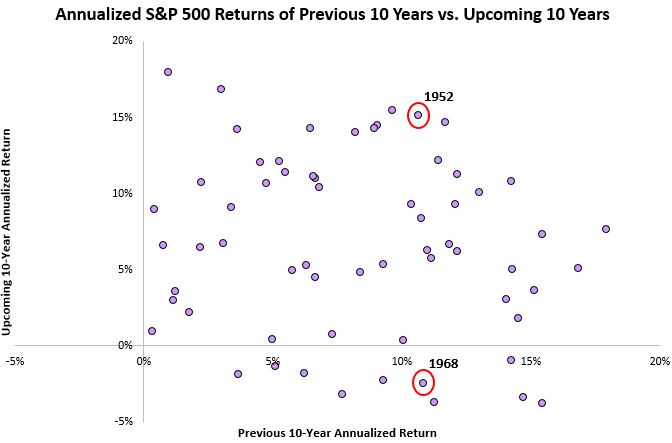
The upcoming 10-year returns are also wildly spread out.
For example, in 1968 the S&P 500 had delivered 10.8% annualized returns in the previous 10 years. In the 10 years that followed, the market returned -2% annualized returns.
Conversely, in 1952 the S&P 500 had delivered 10.6% annualized returns in the previous 10 years and went on to deliver 15% annualized returns in the 10 years that followed:
That’s a pretty stark difference.
What Type of Returns Can We Expect in the Next 10 Years?
From this analysis we’ve seen that there is only a weak relationship between previous 10-year returns and future 10-year returns. So, attempting to predict how the S&P 500 will perform over the next 10 years from 2019 through 2028 is quite difficult.
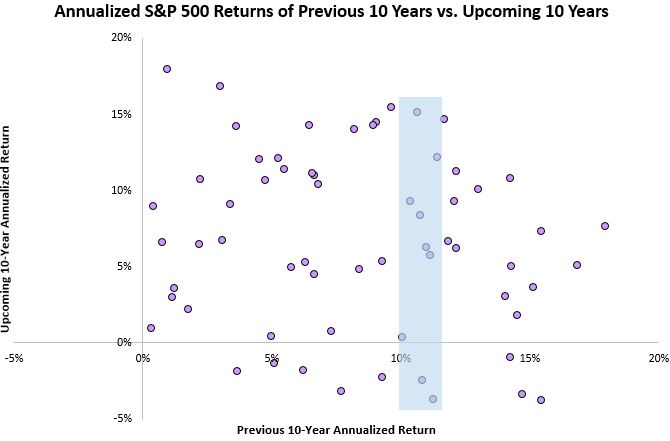
What we do know is that in the previous 10 years from 2009 through 2018 the S&P 500 delivered 11% annualized returns. So, one thing we can do is look at how the S&P 500 has historically performed following periods that have earned around 11% annualized returns.
For example, there have been nine 10-year periods in which the S&P 500 delivered between 10% and 12% annualized returns. In seven of these cases, the S&P 500 went on to deliver positive returns in the following 10 years, with an average annualized return of 6.6%.
Conclusion
This analysis revealed the following:
- There is a weak negative correlation between previous 10-year S&P 500 returns and following 10-year returns. This means higher previous 10-year returns are generally associated with lower following 10-year returns.
- In every scenario where the S&P 500 experienced negative annualized returns during the previous 10 years, it went on to deliver highly positive annualized returns in the following 10 years.
- Generally speaking, it’s fairly hard to predict how the stock market will perform in the upcoming 10 years, even if you know how it performed in the previous 10. This is why, for most investors, dollar-cost averaging will lead to better long-term results than attempting to time the market and predict how it will perform in the future.
Thanks for reading 🙂
Note: All charts used in this post were created in Excel. To find out how to create similar charts yourself, grab a copy of the Excel Genius Toolkit.
- The Ad Revenue Grid - August 6, 2021
- Attract Money by Creating Value for a Specific Audience - July 13, 2021
- The 5-Hour Workday - March 26, 2021
Full Disclosure: Nothing on this site should ever be considered to be advice, research or an invitation to buy or sell any securities, please see my Terms & Conditions page for a full disclaimer.
