
4 min read
I recently stumbled upon a fascinating site called Portfolio Charts. The author of the site has done some serious heavy research and has outlined how 18 different portfolios have performed since 1970.
The various portfolios include the All Seasons portfolio popularized by Tony Robbins, the Total Stock Market portfolio popularized by JL Collins, the Classic 60-40 portfolio popularized by Jack Bogle, the Three Fund portfolio popularized by the Bogleheads, and several others.
I thought it would be neat to summarize the historical performance of these 18 portfolios.
The 18 Portfolios – Asset Allocation
First, here are the 18 different portfolios along with their asset allocation.
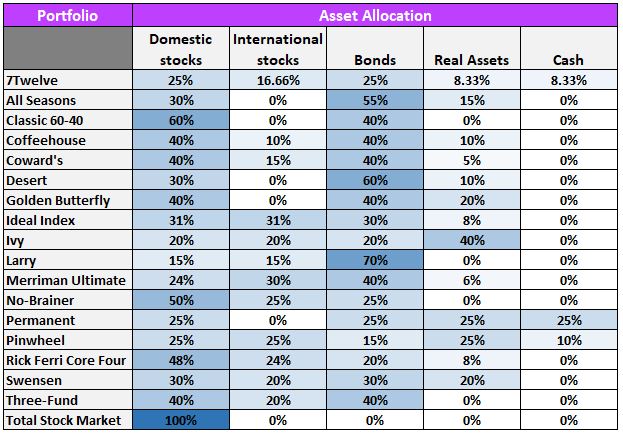
A few technical notes:
- For some portfolios, Domestic stocks are further broken down into small cap, mid cap, and large cap stocks.
- For some portfolios, International stocks are further broken down by regions such as European, Asia-Pacific, Emerging markets, etc.
- For some portfolios, Bonds are further broken down by short-term and long-term bonds.
- For some portfolios, Real Assets are specified as REITs, gold, and/or commodities.
You can find the specific details of each portfolio allocation here.
The 18 Portfolios – Performance
Next, here is how each portfolio has performed since 1970:
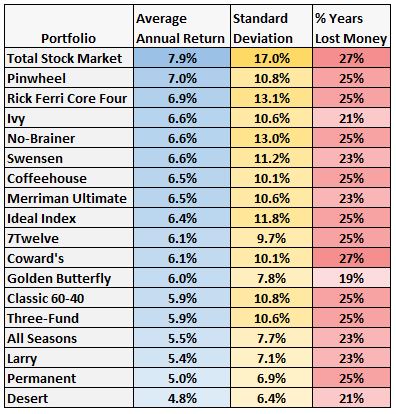
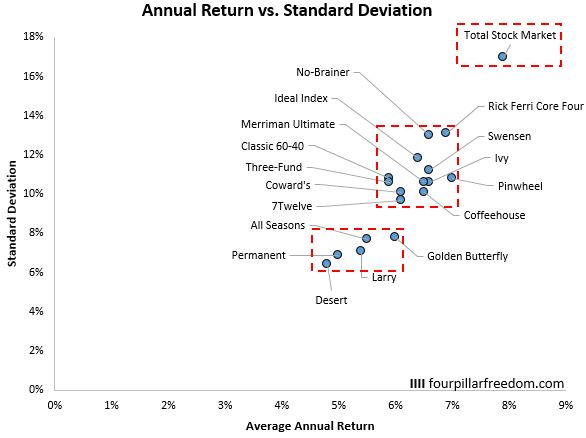
This scatterplot shows the average annual return vs. the standard deviation of each portfolio:
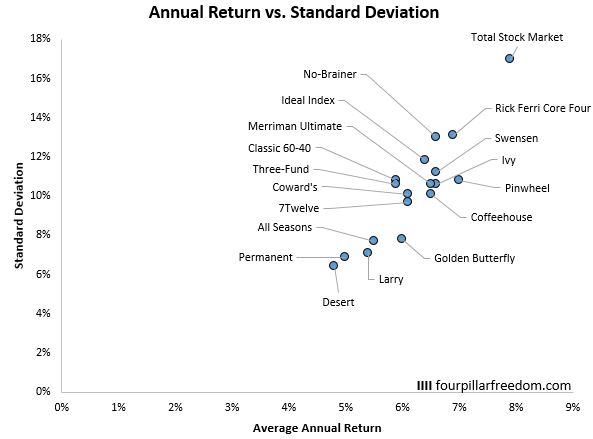
The pattern here is obvious: The higher the average annual return, the higher the standard deviation. This makes sense as portfolios with higher returns tend to be more stock-heavy, which comes with more volatility.
Some portfolios seem more optimal than others, though. For example, the Pinwheel portfolio has had a 7.0% annual return with a standard deviation of only 10.8%, while the Ricki Ferri Core Four portfolios has had a 6.9% annual return with a standard deviation of 13.1%. This means the Pinwheel portfolio outperformed and did so with lower volatility.
The clear outlier in this chart is the total stock market portfolio, which has experienced the greatest returns and the greatest volatility compared to all the other portfolios:
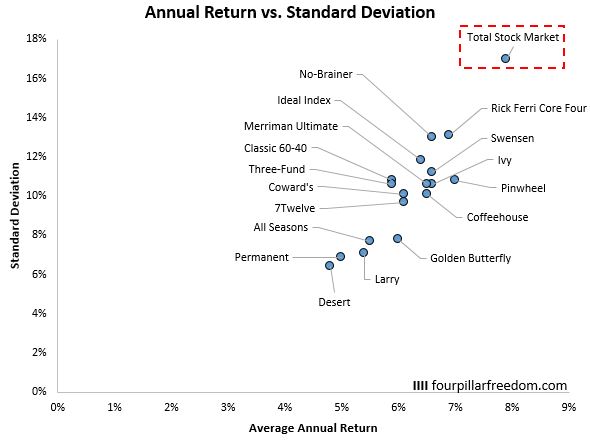
This is the exact reason JL Collins recommends this portfolio for young people: it will likely deliver the highest returns, and since young people have long investment time horizons, they have plenty of time to ride the wave of volatility that comes with this portfolio.
Three Types of Portfolios
It’s interesting to note that there seem to be three types of portfolios:
- High volatility, High Returns (Total Stock Market portfolio)
- Medium volatility, Medium Returns
- Low volatility, Low Returns
High Volatility, High Return Portfolios
The total stock market portfolio is simply in a league of its own. It has high returns and high volatility.
Medium Volatility, Medium Return Portfolios
Of the portfolios with medium volatility and medium returns, the Pinwheel portfolio seems to be the clear winner:
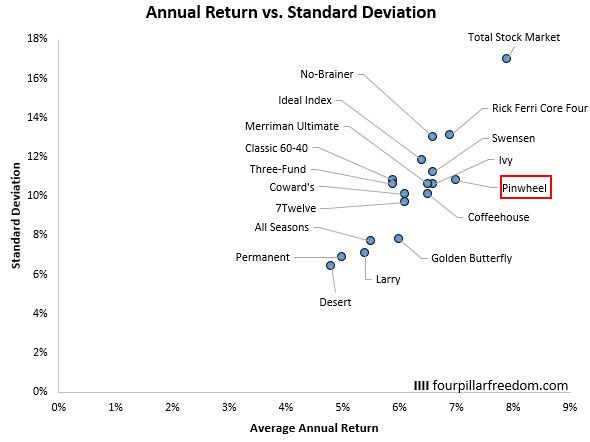
Since 1970 it has experienced 7.0% annual returns and a standard deviation of 10.8%, which means it has delivered higher returns and lower volatility than the following portfolios:
- Ricki Ferri Core Four Portfolio
- No-Brainer Portfolio
- Swensen Portfolio
- Ideal Index Portfolio
Low Volatility, Low Returns
Among the portfolios with low volatility and low returns, the Golden Butterfly seems to be the clear winner:
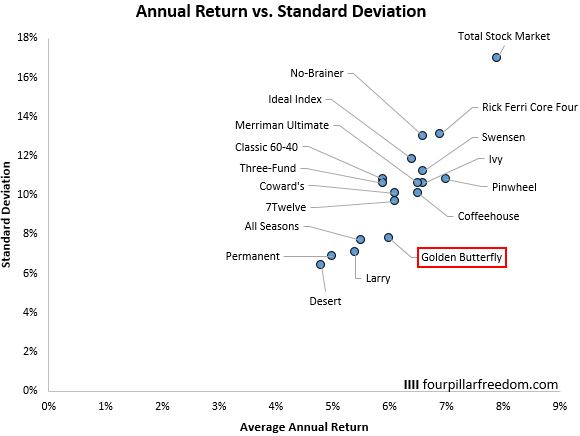
Since 1970 it has experienced 6.0% annual returns and a standard deviation of 7.8%, which means it has delivered higher returns and lower volatility than the Three-Fund and the Classic 60-40 portfolio.
Simple vs. Complex Portfolios
When it comes to investing, expected risk and return is important, but sometimes simplicity is important too.
For example, The Merriman Ultimate portfolio has historically provided higher returns than the Three-Fund portfolio and the Classic 60-40 portfolio and done so with less volatility, but it requires an investor to invest in 12 unique asset classes. By contrast, the Three-Fund portfolio only requires three asset classes and the Classic 60-40 only requires two.
For some investors, they’re willing to trade a little bit of performance for simplicity. The Three-Fund and Classic 60-40 portfolios are dead simple to manage, which is why they’re so appealing.
Investigate Further
If you really want to geek out, check out these portfolios in more depth at Portfolio Charts. There is much more info on historical returns, drawdowns, and risk that I didn’t cover in this post.
Bonus: If you want to actually construct these portfolios yourself, you can do so for free using M1 Finance, a platform that allows you to build a custom portfolio of stocks or ETFs without paying any trading fees. Check out my complete review of M1 Finance here.
- The Ad Revenue Grid - August 6, 2021
- Attract Money by Creating Value for a Specific Audience - July 13, 2021
- The 5-Hour Workday - March 26, 2021
Full Disclosure: Nothing on this site should ever be considered to be advice, research or an invitation to buy or sell any securities, please see my Terms & Conditions page for a full disclaimer.
