
2 min read
NOTE: All calculations below use inflation-adjusted annual S&P 500 returns
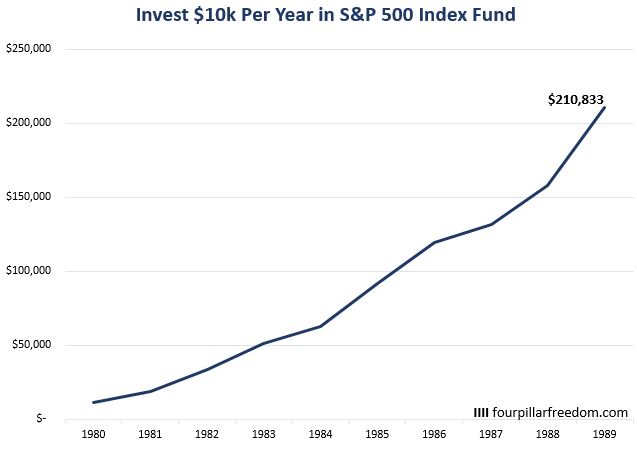
If you invested $10,000 in an S&P 500 index fund at the beginning of each year from 1980 to 1989, you would have ended up with $210,833.
If instead you invested $10k each year from 1990 to 1999, you’d have ended up with $280,019:
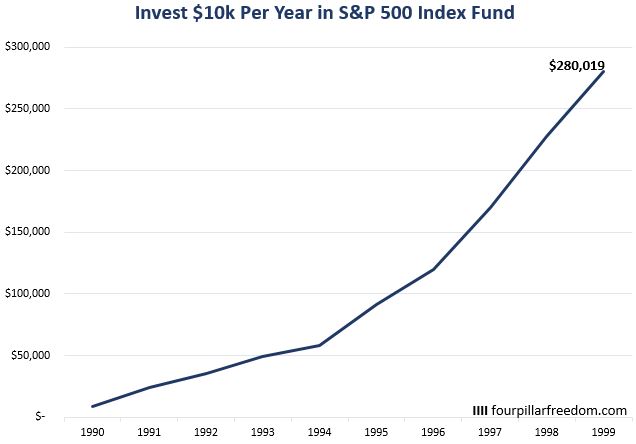
That’s $70,000 more through sheer luck from investing in a better decade of returns.
And if you invested $10k each year from 2000 to 2009, you would have ended with a pitiful $92,001.
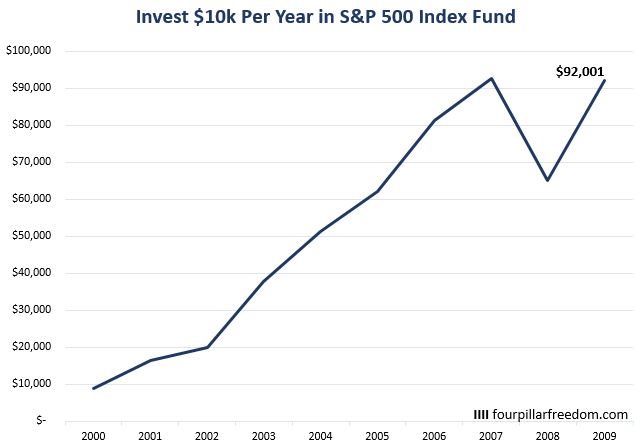
That’s less than a third of what you would have accumulated from 1990 to 1999.
In a given decade, it’s terribly difficult to predict how the stock market will perform.
The strategy of investing $10k in an S&P 500 fund each year for a decade can result in wildly different ending amounts depending on the decade.
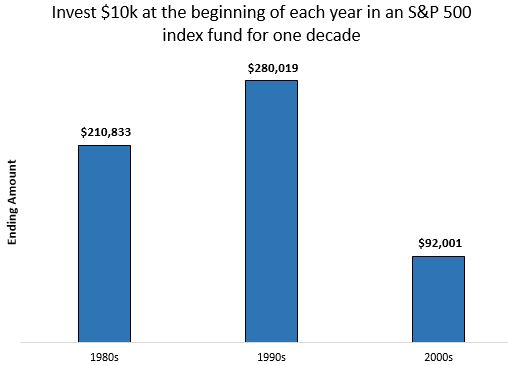
Fortunately, most investors experience more than one decade of market returns, so an awful decade like the 2000s can be offset by good returns in following years.
Consider someone who invested $10k at the beginning of each year from 2000 to 2017. By the end of 2009, we saw that they would have ended up with $92,001. But by the end of 2017 they would have ended with $366,744.
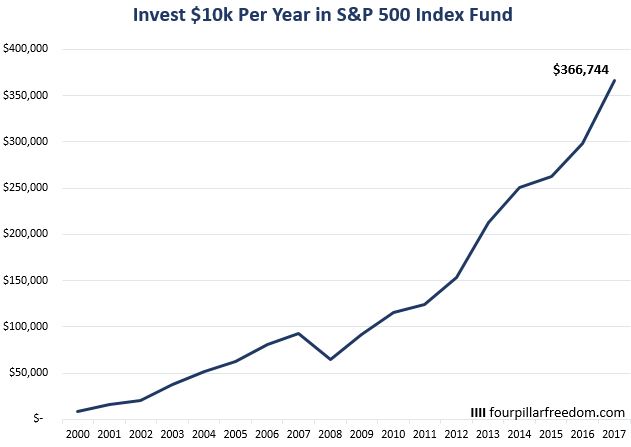
Their net worth would have nearly quadrupled in the eight years following the awful 2000-2009 stretch.
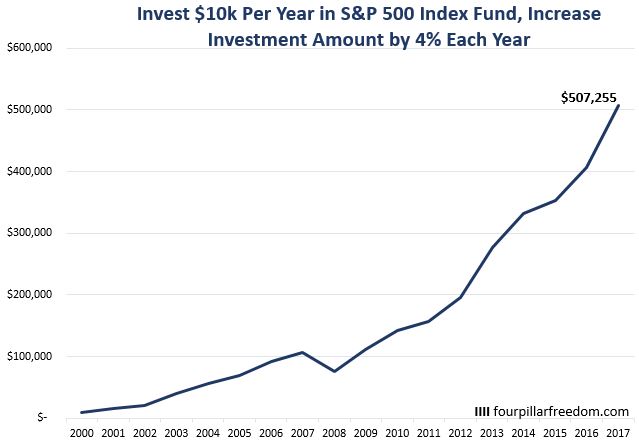
If this person utilized the magic of increasing their investment amount each year, the picture would have been even rosier. For example, if they invested $10k in 2000 and increased their investment amount by 4% each year after, they would have instead ended up with $507,255 by the end of 2017.
S&P 500 Return Calculator
It’s fascinating to see how different investment horizons and contribution amounts performed during different time periods historically, which is why I built an Excel spreadsheet that lets you see how any investment in an S&P 500 index fund performed since 1928.
This spreadsheet lets you define the starting year, the first year contribution amount, the annual contribution increase, and the total number of years. It then outputs the ending amount and the percentage of the ending amount that came from contributions vs. investment returns:
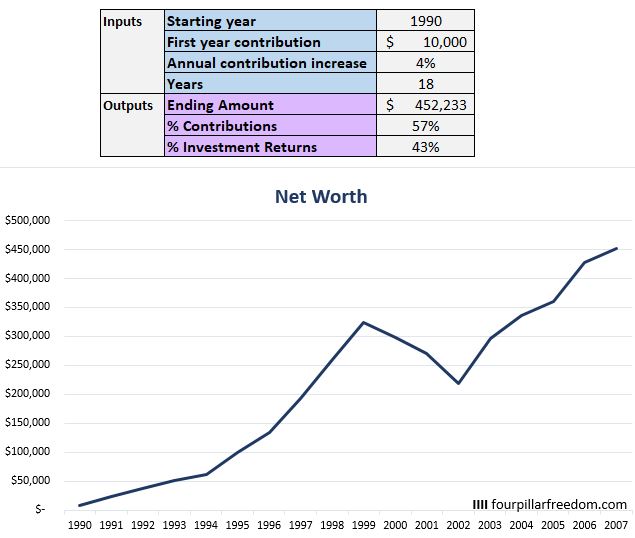
When you change the inputs, the outputs and the line chart update automatically.
The calculator assumes all investments are made in an S&P 500 index fund and uses historical inflation-adjusted annual returns dating back to 1928.
The first tab on the spreadsheet is titled “calculations”, which you can ignore unless you want to see what’s under the hood. The second tab, “dashboard”, is where you can safely change the inputs.
Download the spreadsheet for free here.
My favorite free financial tool I’ve been using since 2015 to manage my net worth is Personal Capital. Each month I use their free Investment Checkup tool and Retirement Planner to track my investments and ensure that I’m on the fast track to financial freedom.
- The Ad Revenue Grid - August 6, 2021
- Attract Money by Creating Value for a Specific Audience - July 13, 2021
- The 5-Hour Workday - March 26, 2021
Full Disclosure: Nothing on this site should ever be considered to be advice, research or an invitation to buy or sell any securities, please see my Terms & Conditions page for a full disclaimer.

Very cool, great job man. It is amazing to see how a little bit of difference can make things change drastically!
Thanks man! It is certainly fascinating to see how returns fluctuated during different time periods. Hope you enjoy exploring the calculator.