
4 min read
One of my favorite new blogs is Engaging Data. The author has a handful of interactive data visualizations and calculators that are fun to play around with.
My favorite one is the Retirement Calculator. As described by the author:
“This early retirement calculator / visualizer is designed to project the number of years until you can retire, based upon a few key inputs such as annual income and spending, income growth rate, expected annual spending in retirement and asset allocation.”
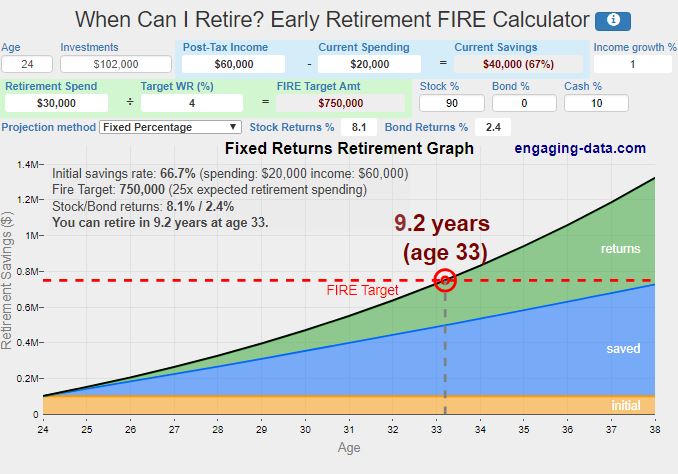
Here’s a look at the calculator filled in with my own inputs:
Inputs
Age: 24
Investments: $102,000 (this is the sum of all my cash and investments)
Post-Tax Income: $60,000 (my current post-tax income)
Current Spending: $20,000 (my current annual spending)
Income Growth: 1% (this is the default)
Retirement spend: $30,000 (this is how much I plan to spend each year in retirement)
Target WR (%): 4% (this is the default – it’s the percentage of my portfolio I plan to withdraw each year in retirement to support my lifestyle)
Allocation: 90% Stock/ 0% Bond/ 10% Cash
Projection Method: Fixed Percentage (this assumes stocks will have a real return after inflation of 8.2% per year and bonds will have a real return of 2.4% per year, which are the historical average returns for these asset classes from 1871 to 2015)
Output
Based on these inputs, I would have 25x my annual expenses saved up in 9.2 years by age 33:
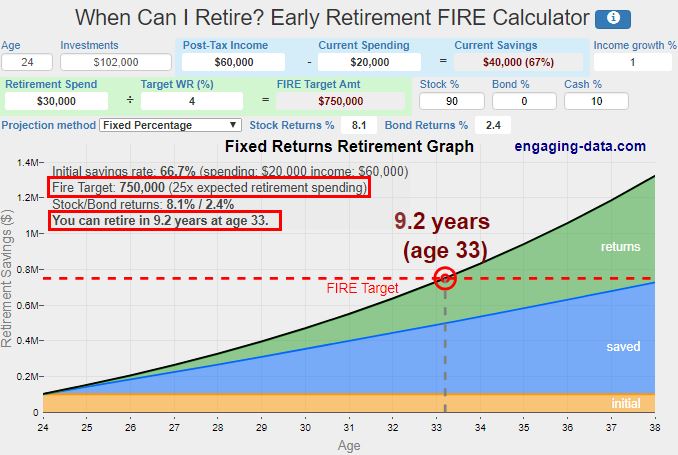
One of my favorite parts about this calculator is that you can tweak the expected stock and bonds returns. The defaults are set to 8.1% and 2.4% annual returns, which are the average real returns from 1871 to 2015.
To be a little more conservative, I’ll change the expected annual stock returns to 5%. I’ll leave the annual bond returns unchanged since I have a 0% bond allocation anyway. Here’s the impact of this change:
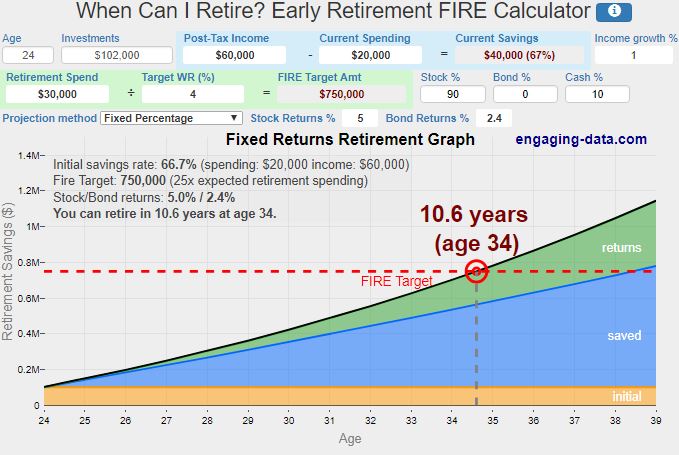
My expected time to retirement increased by 1.4 years.
Let’s try tweaking the income growth number. Currently it’s set to 1%, which means I expect my real income to grow (after inflation) at 1% per year. I feel confident that I can grow it by considerably more than that each year, so I’ll change that number to 5%. Here’s the impact of this change:
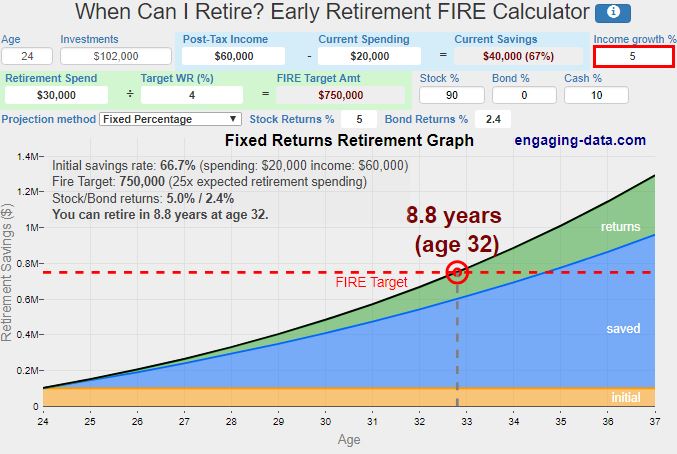
This drops my expected time to retirement down to just 8.8 years! This means if I can grow my income by 5% annually, I could shave off about two years of mandatory working.
Another feature that I love about this calculator is the option to make your current spending different from your retirement spending. This is particularly useful for me because I only spend about $20,000 per year right now. By the time I reach retirement I assume I’ll have a wife and kids, so let’s see the impact of changing my “retirement spend” to $40,000 annually:
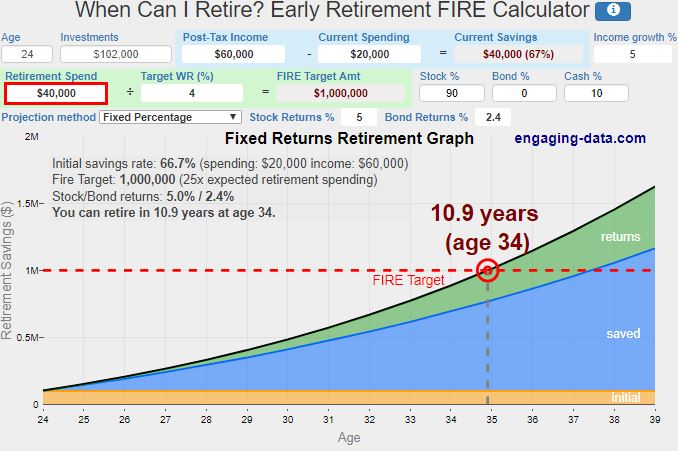
This bumps my time to retirement back up to 10.9 years.
There’s one more input I’m curious about tweaking: the withdrawal rate percent. Suppose I want to quit my day job before I accumulate 25 times my annual expenses. For example, if I want to quit with only half that amount saved up – 12.5 times my annual expenses – I could simply increase my withdrawal rate by twice the amount to 8%.
Effectively I’m telling the calculator that I only want to save up $500,000 (12.5x my annual expenses) instead of $1 million (25x my annual expenses). Let’s see the impact of this change:
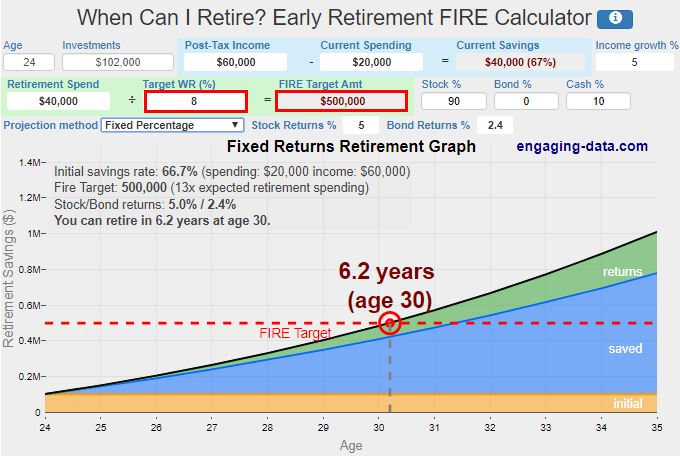
By choosing to save only $500k instead of $1 million, I could quit my day job in just 6.2 years. Granted, an 8% withdrawal rate is likely to exhaust my retirement portfolio well before I grow old, which means I would have to earn additional income through active work. Luckily I’m okay with this strategy and I do plan to earn income through doing work I enjoy once I quit my day job.
Yet another cool feature of this calculator is that you can change the “projection method”, so instead of making predictions about future stock and bond returns, you can use actual stock and bond returns over the past 131 years to see how soon you could have reached your savings goal based on historical returns.
Let’s see the impact of changing the “projection method” to “Historical Cycles”:
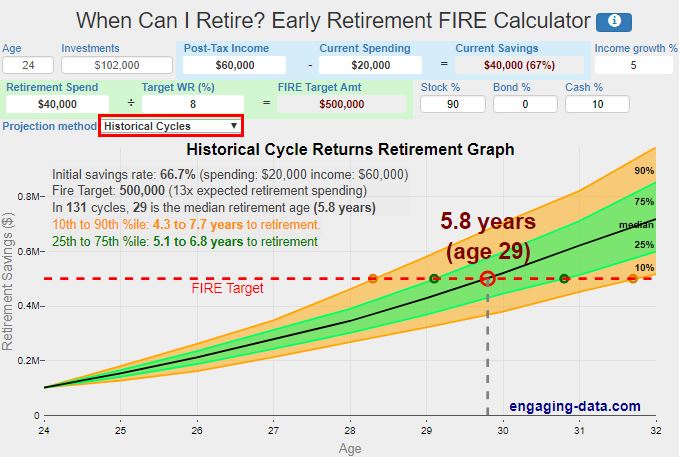
Using this projection, we get a range of values. The calculator tells us that based on the inputs I provided, over the past 131 years the median time to retirement would have been 5.8 years, while the range from the 10th to 90th percentile was 4.3 years to 7.7 years.
I like using historical data because it lets you see that the time it takes to reach your financial goal can vary based on market returns during different periods.
Check out the calculator yourself to see how your own inputs impact your time to retirement.
- The Ad Revenue Grid - August 6, 2021
- Attract Money by Creating Value for a Specific Audience - July 13, 2021
- The 5-Hour Workday - March 26, 2021
Full Disclosure: Nothing on this site should ever be considered to be advice, research or an invitation to buy or sell any securities, please see my Terms & Conditions page for a full disclaimer.

Awesome calculator; thanks! I am decades older than you, but find wisdom in your blog.
Thanks for the kind words, Jill! Glad you found the calculator and this blog helpful 🙂
Awesome stuff! Thank you very much for all posts. I am a regular reader for few months now and really appreciate your work.
Thanks Remik! Glad to hear you’re finding the posts valuable!
Zach,
great post and thanks so much for sharing my calculator. I’m glad that you find it useful, and hopefully your readers will too.
You can also use the Monte Carlo simulation to run similar probabilistic scenarios like the “Historical Cycles Approach” but with more conservative values like the 5% real stock return you used in your example.
And congrats on your progress to FIRE as well.
Thank YOU for making the calculator. It’s one of the best ones I have come across for calculating time to retirement. I love how flexible all the inputs are as well. And I noticed the Monte Carlo simulation as well, but I didn’t get into the details of it in this post. That’s a neat feature as well. Keep up the great work on your end, I’m looking forward to see what else you create in the future!
The calculator says I still have 7 years left before I can retire. At my current income level that is. I was hoping for 2-3 years!
I guess I’ll have to up the side-hustles and make some more money, 7 years seem so far away.
As you said, you can either increase the gap between income and spending or you could potentially quit before you have 25x expenses saved up. It’s good to keep your options open.
Okay, checking this calculator out because it looks awesome. I like tweaking to 12.5% to show another life option. My biggest issue with retirement calculators personally is a large of our investments are cash flow focused not straight investment returns, so it makes these calculators a little wonky for our personal situation.
Sounds like you should make a new calculator that has a cash flow option 🙂 . I’d be interested in seeing that!
Awesome explanation of the calculator. I was actually playing with it last night – I think my partner saw it in /r/FI. Some calculators say my current FIRE target in 2 years is crazy, but not this one – I like that 🙂 . The historical returns option is also amazing, but it’s showing there’s a possibility I could retire in 1.2-1.5 years instead of 2 – don’t tempt me calculator!
Yeah the historical returns option is particularly interesting to play around with since it gives you a range of possible retirement dates based on historical returns. Very cool to hear that you discovered the calc on a Reddit page as well before you even read this post!
This is very cool. Thanks for sharing it! I love playing around with these calculators. If I teach for 30 years, I’ll be able to retire with a full pension (at age 57). Or I could ramp up my investments and retire earlier with a smaller pension. There are so many different scenarios that I play with, but I like the idea of reaching financial independence earlier and not having to work.
Perhaps I’m not understanding the ‘savings’ rate formula on this calculator. Where does ‘Pre-tax’ investments figure into this savings rate? Example: If I max out my 401K and that amounts to 15% of my income shouldn’t that factor into my savings rate?
Looks like a really handy tool – will have to check it out!
Definitely do! It’s a neat tool.