I often receive emails from readers asking about what software I use to create the visuals for my blog posts. Most people are shocked to hear that the majority of the static charts, graphs, and grids are created using Microsoft Excel. Because I have received so much positive feedback about the visuals, I decided to create a short guide for making charts in Excel.
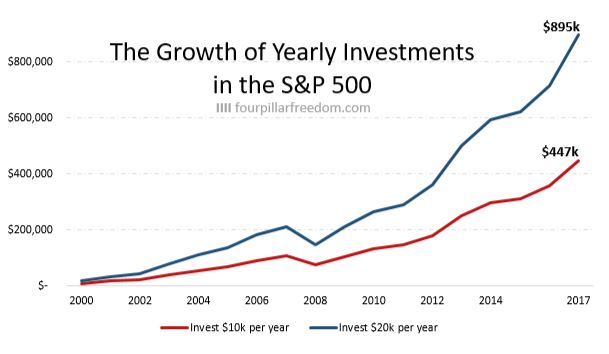
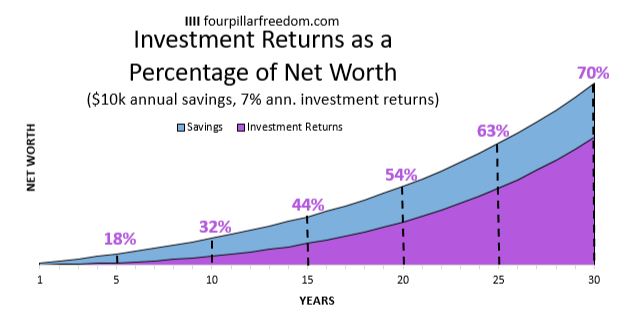
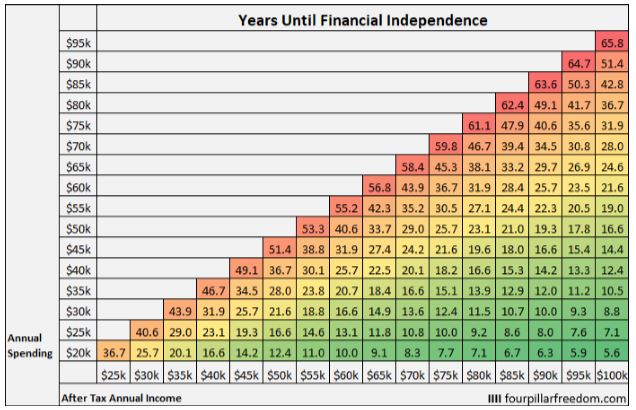
Today I’m excited to share The Tiny Guide to Better Charts in Excel, a free PDF I created that provides tutorials on how to create the three most common visuals I use in my blog posts: line charts, area charts, and grids.
Specifically, the PDF gives step-by-step instructions for creating these three charts:
Line Chart

Area Chart

Grid

Whether you’re a blogger, someone who uses Excel in their day job, or an average Joe looking to improve their visualization skills, this tiny guide will provide you with a solid foundation for creating better charts in Excel.
Technical Note: I built the tutorials for these charts using Microsoft Excel 2013, so I can’t guarantee that the instructions will be compatible with other versions of Excel.
You can download the PDF along with the data for the tutorials by clicking on the links below 🙂
PDF: The Tiny Guide to Better Charts in Excel
Excel Templates: line_chart, area_chart, grid
- The Ad Revenue Grid - August 6, 2021
- Attract Money by Creating Value for a Specific Audience - July 13, 2021
- The 5-Hour Workday - March 26, 2021
Full Disclosure: Nothing on this site should ever be considered to be advice, research or an invitation to buy or sell any securities, please see my Terms & Conditions page for a full disclaimer.

Thank you for sharing your tricks with us. Having never really used spreadsheets for school or work, I’ve had to teach myself to use the software.
I can usually do what I need with the math, but struggle to make pretty charts.
Cheers!
-PoF
No problem, I hope you find the guide useful 🙂
Thanks for your excellent “Tiny Guide”. Any suggestions on how to make the charts interactive on a blog/website?
Thanks
No problem Don! To make the interactive charts I use JavaScript, which is a bit more complex. I may create a Tiny Guide to JavaScript Charts some day though. Stay tuned.