
5 min read
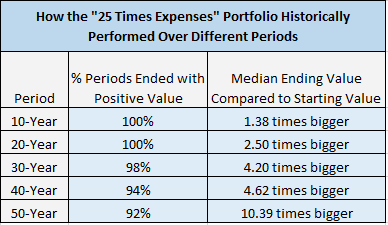
Last week I explored how a “25 times annual expenses” portfolio with a 100% S&P 500 allocation performed from 1928 to 2016. The results were quite remarkable. Not only did this type of portfolio survive nearly all multi-decade time horizons, but the median ending value was typically much larger than the starting value.
Here’s a recap of the results:
Check out the full post to see the entire analysis.
The “25 times annual expenses” portfolio performed so well historically, it begs the question: how have smaller portfolios performed? For example, how have “15 times annual expenses” portfolios performed over time? Do they survive over the course of decades? This is what I aim to explore in this analysis.
The Analysis
If you spend $50,000 per year, a “25 times expenses portfolio” would be a portfolio worth $1.25 million. ($40,000 * 25)
A “20 times expenses portfolio” would be worth $1 million. ($50,000 * 20)
Let’s suppose you save up 20 times your expenses and then retire. You invest the entire $1 million into the S&P 500. You spend the inflation-adjusted equivalent of $50,000 each year to cover your living expenses.
Here is how this portfolio performed over every 10-year time period from 1928 to 2016. Ending values are inflation-adjusted.
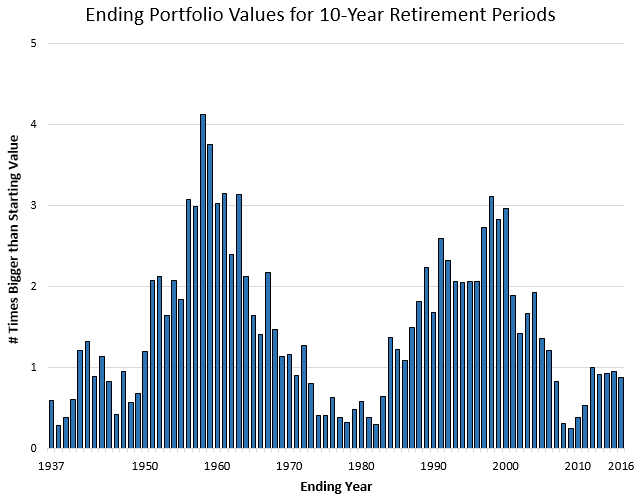
This portfolio survived every 10-year time period between 1928 and 2016. The median ending value was $1,247,000, nearly 1.25 times bigger than the starting value of $1 million.
It’s awesome to see that a “20 times expenses” portfolio survived every 10-year period just like the “25 times expenses” portfolio, but realistically most people will have much longer retirement periods than 10 years. Let’s see how this portfolio performed over longer-stretches of time.
NOTE: All graphs and calculations apply to any level of expenses, i.e. someone who spends $40k per year with a “20 times expenses portfolio” also would have experienced a median ending portfolio value worth 1.25 times bigger than the original amount.
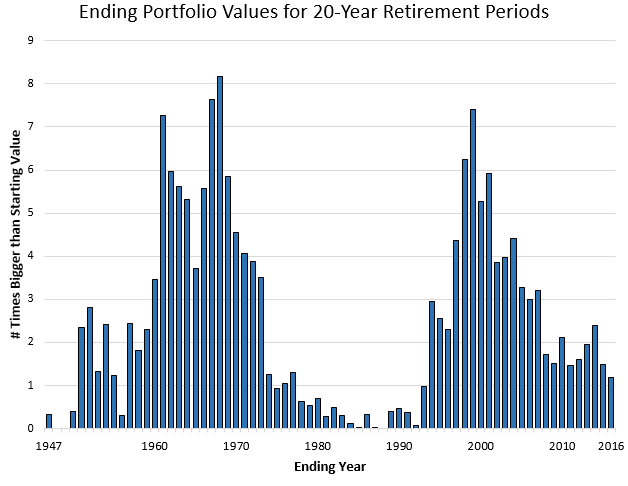
% Portfolios That Survived 20-Year Time Period: 96%
Median Ending Value: 2.03 times larger than original value
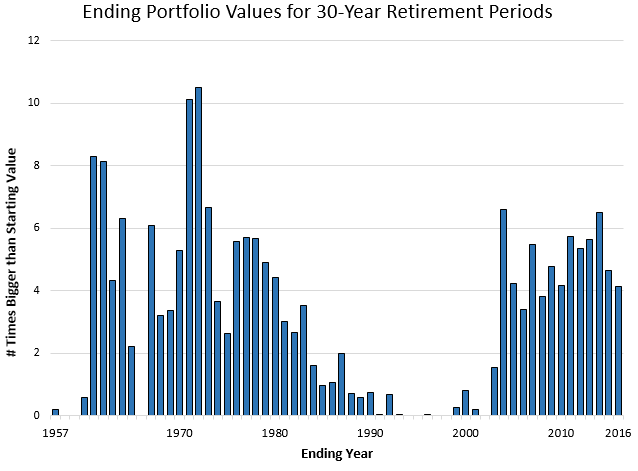
% Portfolios That Survived 30-Year Time Period: 87%
Median Ending Value: 3.29 times larger than original value
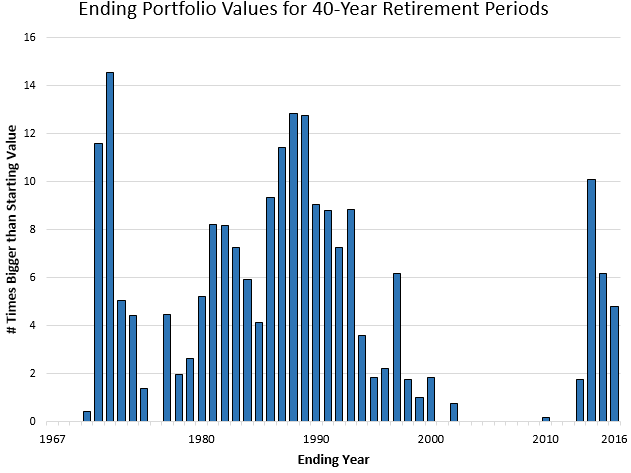
% Portfolios That Survived 40-Year Time Period: 72%
Median Ending Value: 2.41 times larger than original value
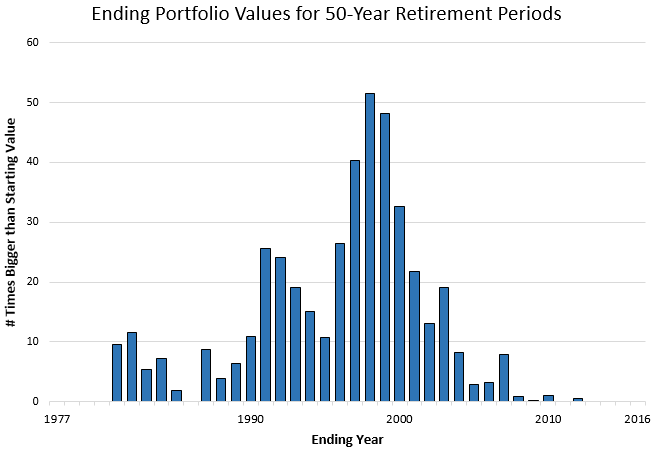
% Portfolios That Survived 50-Year Time Period: 75%
Median Ending Value: 6.81 times larger than original value
The “20 times expenses” portfolio historically performed better than I expected. It “survived” 87% of traditional 30-year retirement periods, although that number is a bit inflated because a few of the ending portfolio values were incredibly small.
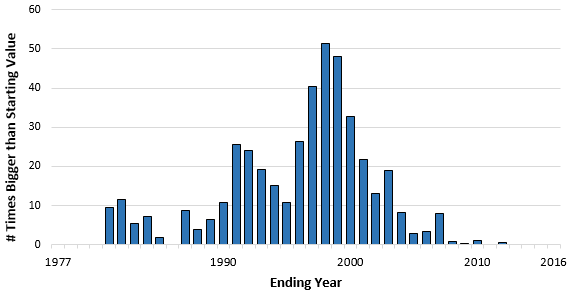
Next, I looked at how smaller portfolios performed over the same time periods. Here, I use lines instead of bars so I can graph multiple portfolios on one graph.
For example, I’ll use this:
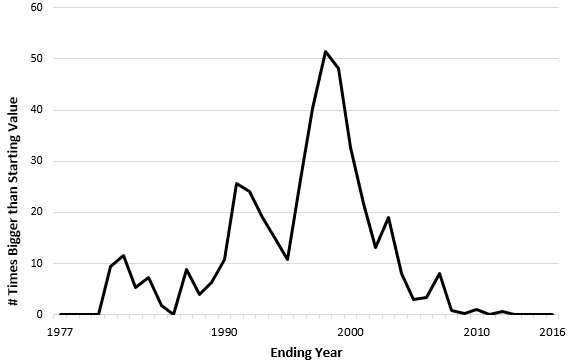
instead of this:
Okay, here’s how 5, 10, 15, 20, and “25 times expenses” portfolios performed over various time periods. Each line represents a different portfolio size. Again, I assume each portfolio is invested entirely in the S&P 500.
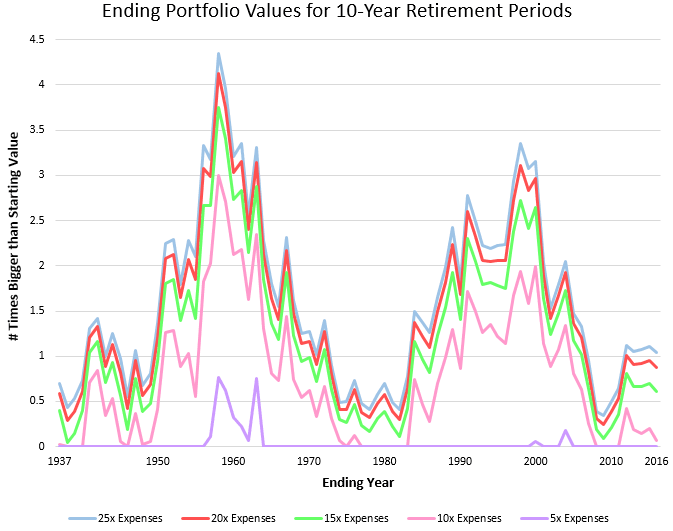
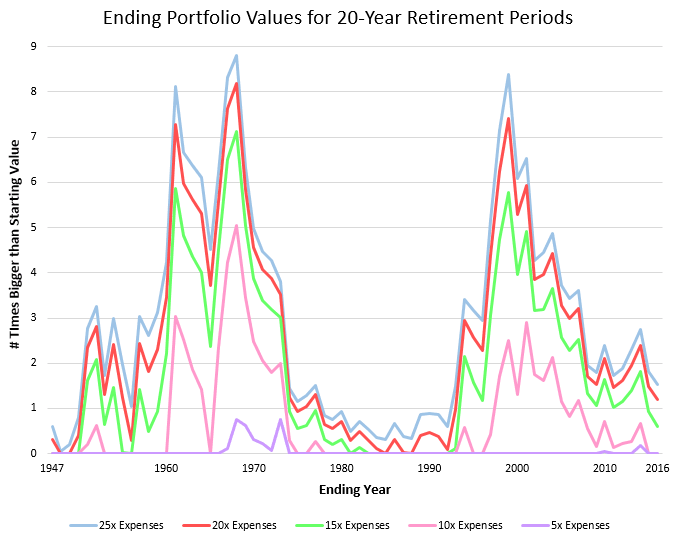
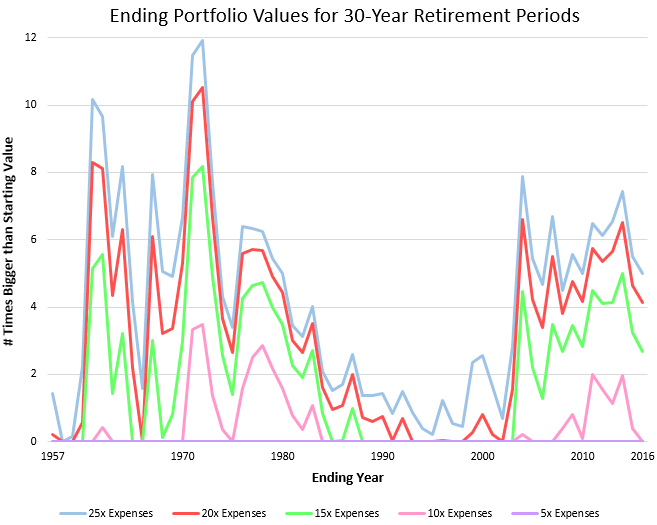
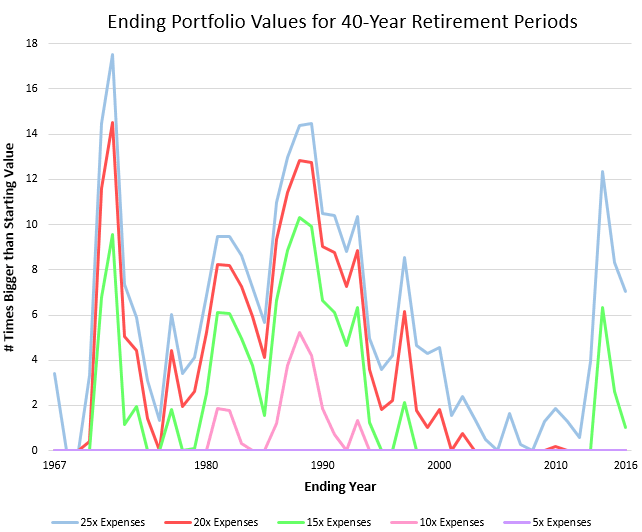
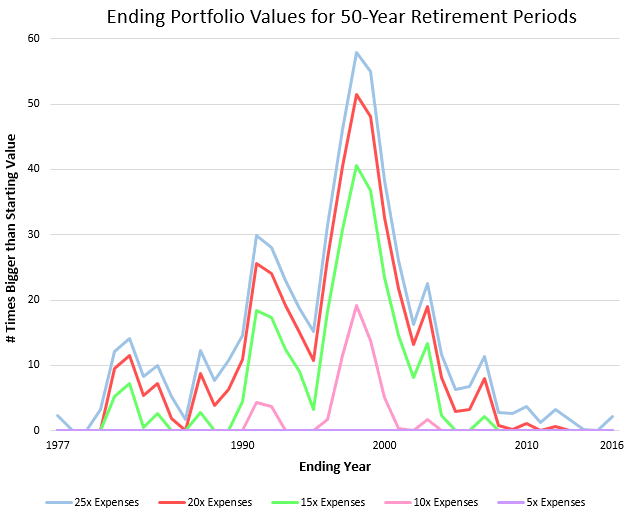
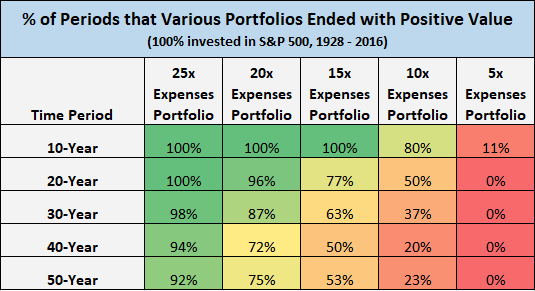
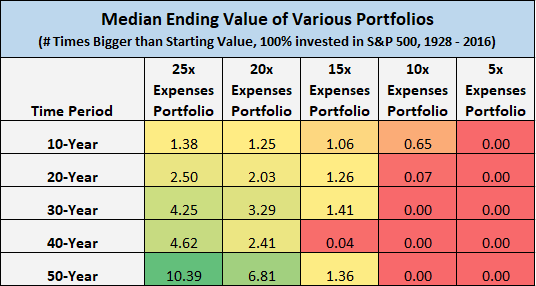
Here are a couple grids that summarize the above graphs.
Closing Thoughts
The line charts are very telling. Specifically, the difference between the ending median values for the 20x and 25x expenses portfolios wasn’t as large as I thought.
The 15x expenses portfolio performed far better than I thought across all time periods.
The 10x expenses portfolio survived 80% of the 10-year time periods, but did awful on longer time periods.
The 5x expenses portfolio did horrible across all time periods. It’s simply not a large enough portfolio to survive and grow on it’s own without additional contributions.
A few things to keep in mind
This analysis assumes 100% of savings are invested in the S&P 500. Most retirees will have at least some money in bonds.
Future returns could be quite different compared to historical returns. Many people think future market returns will be considerably lower than historical averages, especially over the next decade, including Vanguard founder Jack Bogle.
This analysis assumes that your retirement spending will mirror your pre-retirement spending. From what I have read from many early retirees, expenses seem to drop after retirement. This could be due to less commuting, more free time to cook instead of dining out, lower spending on work clothing, etc.
Looking Ahead
This analysis assumes you earn zero dollars in income during retirement. I’m curious, how does part-time work during retirement impact these numbers? Next week I am releasing a follow-up analysis that provides some answers to that question.
Thanks for reading 🙂
- The Ad Revenue Grid - August 6, 2021
- Attract Money by Creating Value for a Specific Audience - July 13, 2021
- The 5-Hour Workday - March 26, 2021
Full Disclosure: Nothing on this site should ever be considered to be advice, research or an invitation to buy or sell any securities, please see my Terms & Conditions page for a full disclaimer.

This is an incredibly interesting analysis. Thank you for taking the time to crunch these numbers!
Like you, I am surprised how well the 20x expenses portfolio performed relative to the 25x portfolio. I agree with your warning that future returns may not be the same as they have been over the past several decades, and I am unlikely to invest 100% of our assets in the stock market. That said, given my expectation that I will eventually receive something from Social Security, your analysis has definitely given me, and the rest of the FIRE community, something to think about!
Thanks again, and I look forward to your follow-up analysis next week!
Thank you, glad you liked it! 🙂
It is pretty incredible to see how smaller portfolios have held up over different time periods. I think once I add part-time work into this analysis, the results will be even more shocking.
Nice data, a lot of that I haven’t seen elsewhere. These kinds of posts are extremely valuable to those that are pondering the risk factors of early retirement especially if they want to take the leap at the earliest possible moment. I think your next post that adds in some income will be awesome as well. My own belief is that most of the 30-50 year old crowd will earn income after they retire. Even if they are like me and have no need of additional money they’ll find they enjoy the productive feeling that comes from adding value and being compensated for it.
I agree with you – I think more and more people are realizing that they don’t have to avoid work and income in retirement and that there are plenty of ways to earn money doing interesting projects. Just being open to part-time work can make a huge difference in how much money someone actually needs to save to retire.
Zach – relatively new reader to your blog, and I have to say what an awesome, different take on personal finance! I’m a numbers (and graphs) kind of person, so your analysis, insight, and data are really incredible.
Thanks, Michael! I think numbers and graphs can help highlight different financial topics better than words alone. Glad you enjoyed the analysis and welcome to the blog! 🙂
Sweet! Thanks for this! I know continuing to my 25x goal is a wise decision. Another informative post.
No problem! Glad you liked it 🙂