
4 min read
Historical data tells us that when you invest in a broad stock market index fund you can expect roughly 7% annual returns (after inflation) over the long run. During any given year, though, the market is not guaranteed to deliver precisely 7% returns.
As evidence, check out the chart below that shows the inflation-adjusted annual returns of the S&P 500 from 1928 through 2018:
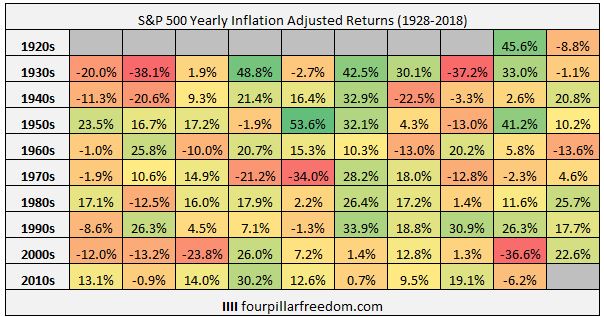
The long-term inflation-adjusted annual return of the S&P 500 varies based on the starting year you choose to look at.
For example, the inflation-adjusted annual return (let’s call this IAAR, for short) from 1928 to 2018 was 6.3%. The IAAR from 1932 to 2018 was 7.1%. The IAAR from 1942 to 2018 was 7.4%. Depending on which time period you look at, the long-term IAAR for the S&P 500 hovers between 6 to 8%.
But here’s a fun trivia question: During how many individual years from 1928 to 2018 did the S&P 500 deliver between 6 and 8% inflation-adjusted returns?
The shocking answer: Just two years!
In 1993 and 2004, the S&P 500 delivered 7.1% and 7.2% inflation-adjusted returns, respectively. In every other year since 1928, the index delivered returns outside of the 6-8% range.
As evidence, check out the chart below that shows the S&P 500 inflation-adjusted annual returns for every year from 1928 to 2018, sorted from best to worst:
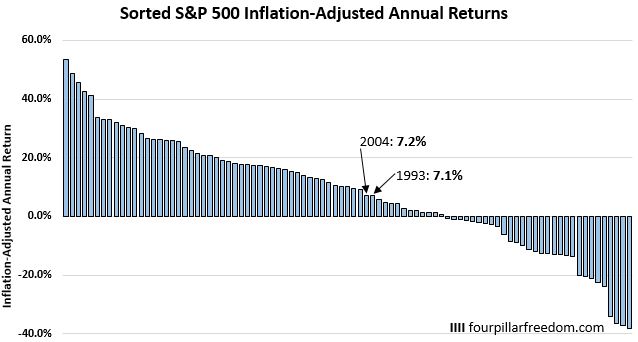
Over the long haul, the S&P 500 has typically delivered between 6 to 8% returns, but it’s actually extremely rare for the index to deliver these type of returns in any given year.
How Often Does the S&P 500 Deliver Average Returns Over Longer Periods?
The fact that the S&P 500 doesn’t deliver between 6 to 8% returns each year shouldn’t scare investors who have a long investment time horizon.
In some years the index will deliver positive returns. In other years, negative. The longer your investment time horizon, though, the higher the likelihood that you’ll experience positive returns.
To illustrate this, check out the chart below that shows every 10-year inflation-adjusted annualized return for the S&P 500 since 1928, sorted from best to worst:
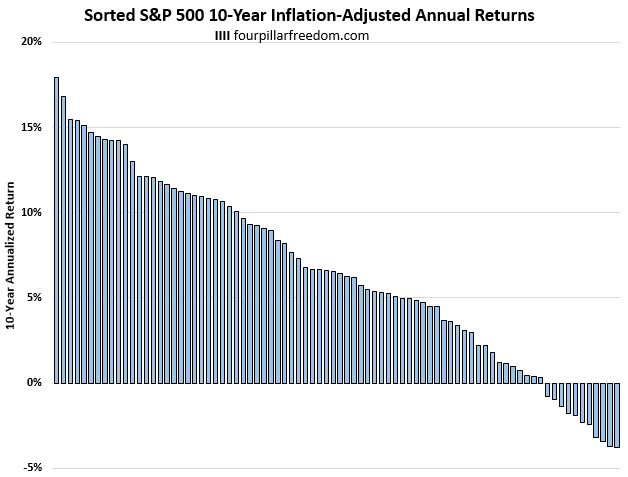
During the best 10-year period, the S&P 500 delivered nearly 18% annualized returns and during the worst period it delivered -3.8% annualized returns.
In 68% of all 10-year periods, the S&P 500 delivered 4% annualized returns or higher.
Let’s check out the annualized returns for all 20, 30, and 40-year periods as well:
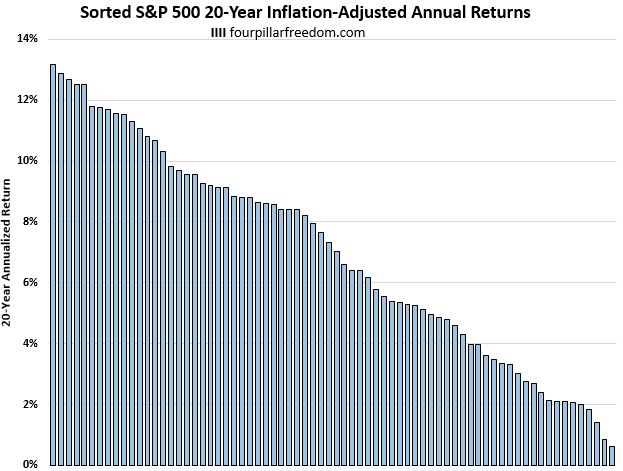
During the best 20-year period, the S&P 500 delivered 13.2% annualized returns and during the worst period it delivered 0.6% annualized returns.
In 74% of all 20-year periods, the S&P 500 delivered 4% annualized returns or higher.
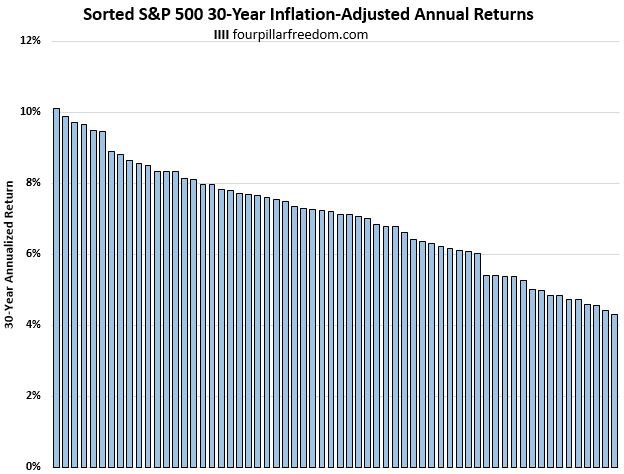
During the best 30-year period, the S&P 500 delivered 10.1% annualized returns and during the worst period it delivered 4.3% annualized returns.
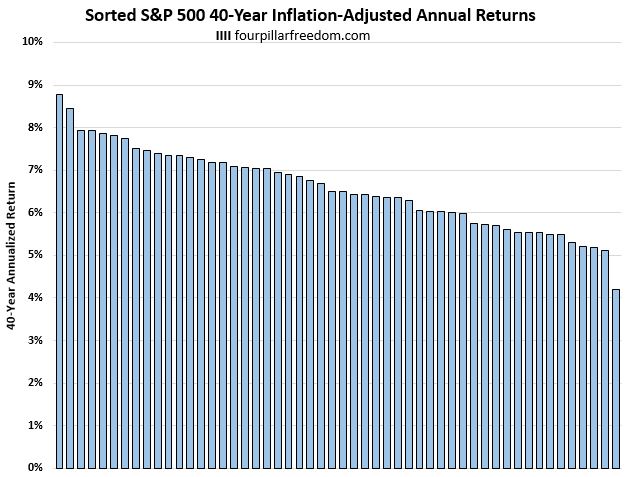
During the best 40-year period, the S&P 500 delivered 8.8% annualized returns and during the worst period it delivered 4.2% annualized returns.
Investing for the Long Haul
In this post we saw something profound: During individual years, the S&P 500 has delivered anywhere from -38.1% to 53.6% returns. During 40-year periods, though, the S&P 500 has delivered between 4.2% and 8.8% annualized returns.
The charts below show this massive difference:
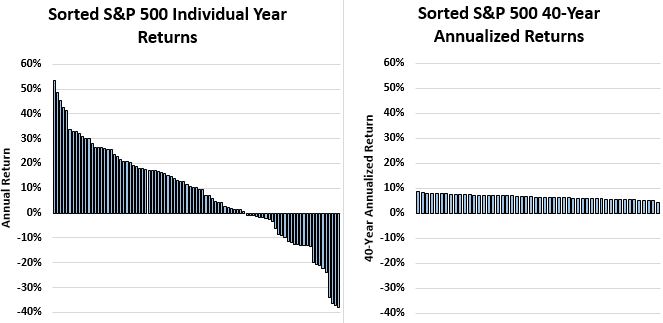
During individual years, you can get a wide variety of market returns. Over 40-year periods, though, your variation in returns is much smaller and your odds of earning positive returns are much higher.
This is important for investors to remember: When you invest in a stock market index fund, you’re actually unlikely to earn “average” returns in any given year.
The longer you hold your investments, though, the higher the likelihood that you will earn positive returns.
- The Ad Revenue Grid - August 6, 2021
- Attract Money by Creating Value for a Specific Audience - July 13, 2021
- The 5-Hour Workday - March 26, 2021
Full Disclosure: Nothing on this site should ever be considered to be advice, research or an invitation to buy or sell any securities, please see my Terms & Conditions page for a full disclaimer.
