4 min read
All of the following calculations use inflation-adjusted S&P 500 returns and assume that dividends were reinvested each year. I gathered data for this post from NYU Stern.
If you invested $100 into the S&P 500 at the beginning of 1999, that $100 would have been worth just $68 by the end 2008. This marked the worst 10-year investment period ever for the S&P 500 since 1928.
However, if you invested $100 into the S&P 500 at the beginning of 1949, that $100 would have blossomed into $521 just ten years later by the end of 1958. This marked the best 10-year investment period ever for the S&P 500 since 1928.
That’s a massive difference in returns between the best and the worst 10-year periods.
This brings up an interesting question: what have been the best and worst investment returns during every possible period since 1928? For example, what are the best and worst 3-year returns? Or 15-year returns? Or 40-year returns?
Let’s find out!
The Best & Worst Investment Periods in History
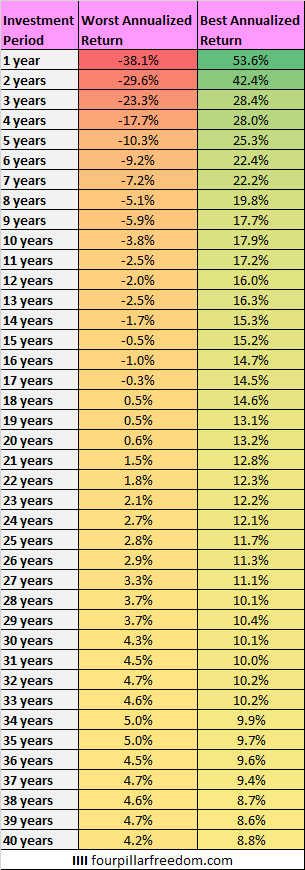
The following table shows the best and worst annualized returns for every investment period since 1928 ranging from a period of 1 year up to 40 years:

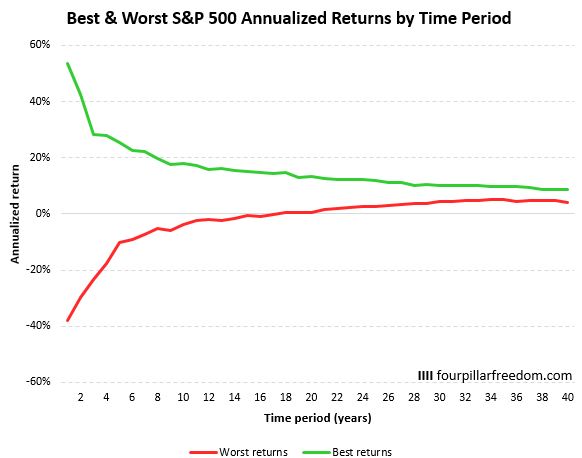
And here’s a visual look at those numbers:

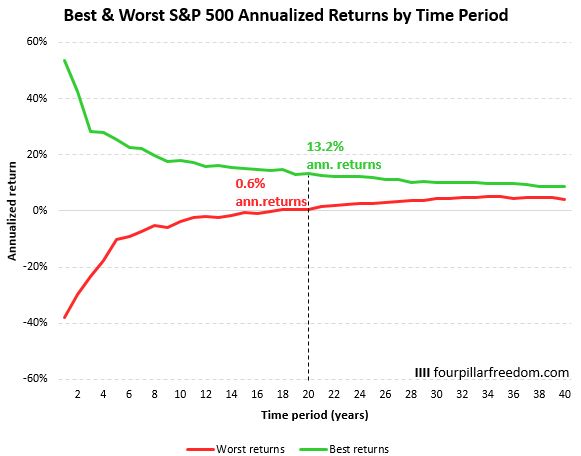
The green line shows the best returns and the red line shows the worst returns by period. For example, during the best 20-year period, the S&P 500 delivered 13.2% annualized returns and during the worst 20-year period it delivered just 0.6% annualized returns:

Notice the obvious pattern here: annualized returns can vary significantly during short time frames, but not as much over longer time frames.
For example, the best 5-year period saw annualized returns of 25.3% while the worst 5-year period saw annualized returns of -10.3%.
Conversely, the best 40-year period saw 8.8% annualized returns while the worst 40-year period saw 4.2% annualized returns.
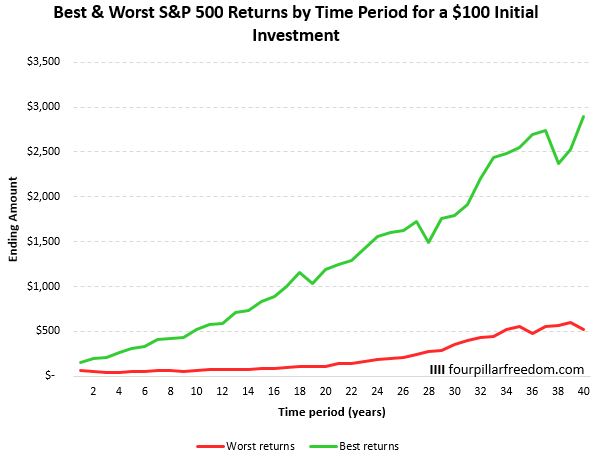
It’s also helpful to think about these returns in terms of dollars. For example, consider if you invested $100 into the S&P 500 in a given year. The following table shows what that $100 would have turned into during the best and worst return periods:

And here’s a visual look at those numbers:

Conclusion
This analysis highlights some interesting findings:
- Annualized investment returns can fluctuate significantly during the short-term, ranging from -10.3% to 25.3% during five-year periods. However, annual returns tend to become more steady over longer time periods, ranging from just 4.2% to 8.8% over all possible 40-year periods.
- The S&P 500 has never experienced a loss during an 18-year period or longer.
- Even during the worst 30-year period, an investment in the S&P 500 more than tripled in value.
- The longer your investment time horizon, the higher likelihood that you’ll experience positive returns. The stock market rewards the patient investor.
Further reading:
Here’s How the S&P 500 Has Performed Since 1928
Here’s How the Stock Market Has Historically Performed After a Down Year
The Amount You Invest Often Matters More Than the Returns You Earn
- The Ad Revenue Grid - August 6, 2021
- Attract Money by Creating Value for a Specific Audience - July 13, 2021
- The 5-Hour Workday - March 26, 2021
Full Disclosure: Nothing on this site should ever be considered to be advice, research or an invitation to buy or sell any securities, please see my Terms & Conditions page for a full disclaimer.
