
3 min read
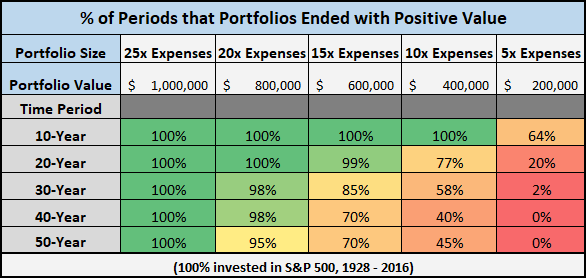
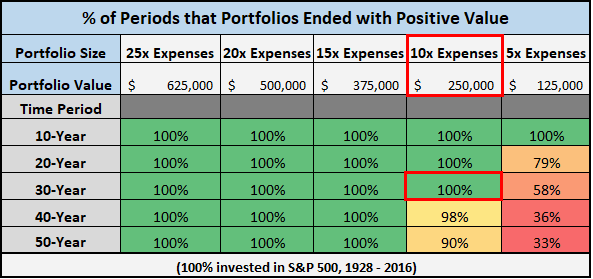
A couple weeks ago, I analyzed how a portfolio worth 25 times one’s annual expenses invested entirely in the S&P 500 performed historically. This table summarizes that analysis:
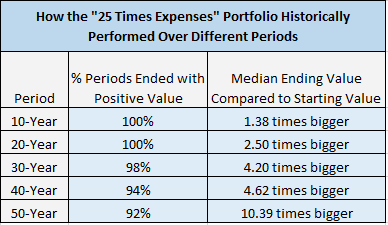
This portfolio not only survived nearly all multi-decade retirement periods, but it dramatically increased in value over the course of most periods. Read the full post for details.
These results were so mind-blowing that I followed it up with another analysis that analyzed how “less than 25 times expenses” portfolios performed over the same time periods. These two tables summarize that analysis:
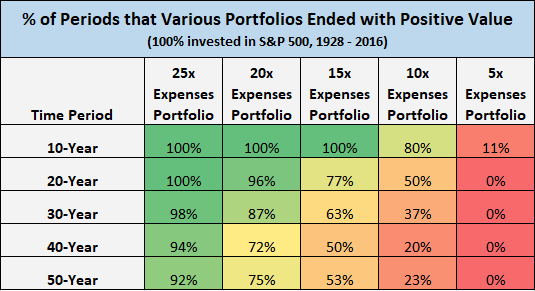
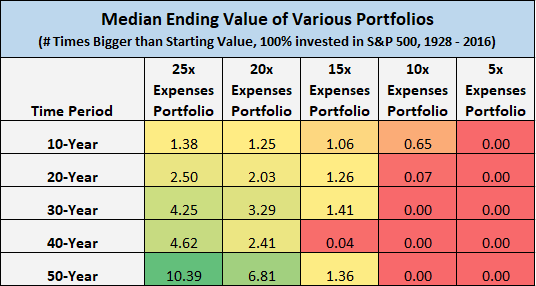
The difference between the ending median values for the 20x and 25x expenses portfolios wasn’t as large as I thought.
The 15x expenses portfolio performed far better than I thought across all time periods.
The 10x expenses portfolio survived 80% of the 10-year time periods, but did awful on longer time periods.
The 5x expenses portfolio did horrible across all time periods. It’s simply not a large enough portfolio to survive and grow on it’s own without additional contributions.
Read the full post for details on that analysis.
Throwing Post-Retirement Income into the Mix
Both of those analyses assumed that you earned zero dollars in income during retirement. This begs for another analysis that answers the question: How does active income during retirement impact when you can retire and how much you actually need to retire?
Let’s run through the numbers…
The Analysis
Using S&P 500 inflation-adjusted returns from 1928 to 2016, I looked at how different-sized portfolios (5x, 10x, 15x, 20x, and 25x annual expenses) performed over different time horizons (10, 20, 30, 40, 50-year periods) with different levels of active income during retirement for different lengths of time.
Wait, what the hell does that all mean?
I know, that’s a lot of information. Because there are so many variables in this analysis, I created an interactive Excel spreadsheet that shows all the data, the formulas, and the results.
You can download the spreadsheet here.
Overview
Here is a quick overview of the spreadsheet. You enter three numbers: your annual spending in retirement, active income in retirement, and how long you plan on earning that active income:

The spreadsheet runs these numbers through all time periods from 1928 through 2016 and spits out two tables.
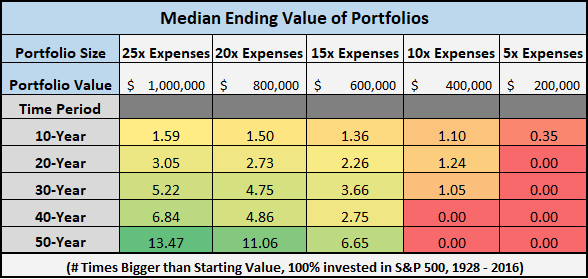
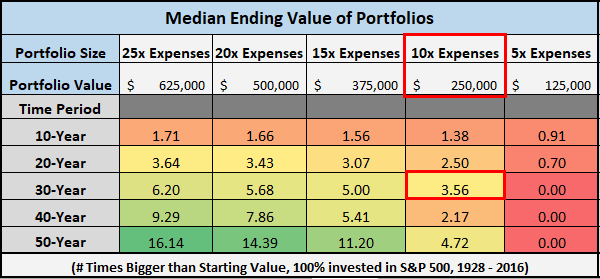
The first table shows the median ending value of different-sized portfolios across different retirement time periods:
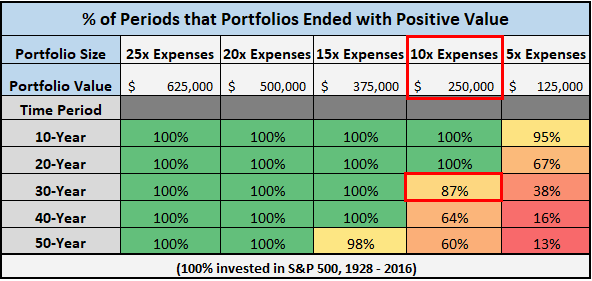
The second table shows the percentage of periods that this portfolio survived various retirement time periods:
Explanation
Here’s an example along with an explanation.
Suppose I expect to spend $25k each year in retirement. I also expect to earn $15k each year as a freelancer for the first 20 years of retirement before I decide to stop earning active income altogether.

Suppose I want to see how this strategy will work if I only save up 10 times my expenses ($250,000) before I quit my day job and enter retirement. It turns out that the median ending value of this portfolio after 30 years was historically 3.56 times bigger ($890,000) than it’s starting value.
However, this portfolio only survived 87% of all 30-year periods:
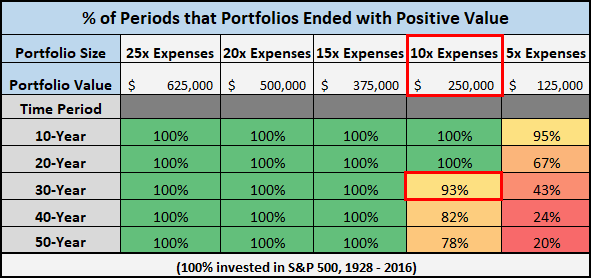
The neat part about this spreadsheet is that you can see how the results change when you tweak the inputs. For example, if I instead enter “25” instead of “20” for the number of active income years, the portfolio success rate for 30-year periods jumps up to 93%:
If I also change the active income from $15,000 to $17,000 per year, the success rate jumps up to 100%:
Give it a Try
Download the spreadsheet and play around with the inputs to see how the results change. I should mention that the first five tabs are all data and formulas. If you’re not interested in the math behind it, just ignore those tabs and use the “Results” tab only. If you have any questions, feel free to leave a comment or shoot me an email.
Thanks for reading 🙂
- The Ad Revenue Grid - August 6, 2021
- Attract Money by Creating Value for a Specific Audience - July 13, 2021
- The 5-Hour Workday - March 26, 2021
Full Disclosure: Nothing on this site should ever be considered to be advice, research or an invitation to buy or sell any securities, please see my Terms & Conditions page for a full disclaimer.

This is great – I’ve kicked around the idea of a “part time FI” for a while but have never run the numbers to see what’s feasible for me. Now I don’t have to because you’ve done it for me! Thanks, Zach!
Thanks, Ty! This is something I have been wanting to do for a long time, I’m glad I finally sat down and ran the numbers. Hope this calculator helps you calculate your part-time FI numbers 🙂
Great addition to the previous post! I put some paid side gigs together mostly for entertainment but in their third year so far they have yet to fail to pay our total household expenses strictly working part time. I plan to keep them going until 70 when social security will be at its max. If I shut them down then I will need about one and a half percent withdrawal rate.
Thanks, Steveark! That’s incredible how beneficial your side hustles are to your financial situation. A 1.5% withdrawal rate is incredibly low!
Awesome stuff Zach! I’m looking through the sheets now.
I learned a pretty cool trick with the conditional formatting you have. I had no idea there was an option to have gradient fill! I just thought you filled in your other projects like the early retirement grid by hand xD
Where did you get your info for the CPI and inflation?
Thanks, Ernie! Yeah, conditional formatting makes everything look more impressive and the gradient fill option is one of my favorite features of Excel. I got the CPI and inflation numbers straight from Dr. Robert Schiller’s site: http://www.econ.yale.edu/~shiller/data.htm
Nice. You might consider using a Google Sheet for the spreadsheet. When I download it for Mac’s Numbers, i get missing font errors and other issues. In addition, the Google sheet can be embedded into your blog post and people can manipulate the data directly within their web browser.
Thanks for the recommendation. I haven’t used Google Sheets before, but I’ll look into them!
I think this is important because if you estimate your expenses x 25 but leave out employer-sponsored healthcare, you are leaving out a $15,000 to $20,000+ expense. So your estimate of $15K extra is pretty close to the low end you’d pay for a high deductible (HSA-eligible) health plan that you’d need to buy out of pocket.
That’s a good point. That expense probably isn’t talked about enough in the F.I. community, but it’s arguably the biggest expense people will have to account for upon retiring. Hopefully this calculator helps people account for that.
Post-retirement income is usually seen as an act of desperation. You spend all your money and have to go back to work at 75. But you illustrated the impact of what a few extra dollars can mean to long term financial security. And, it’s fun to earn money, especially if you are financially independentbecause there is no pressure or obligation.
Great job, Zach.
Thanks, Mr. Grumby! Completely agree with your point about there being no pressure or obligation to earn money once you’re F.I.
This definitely makes any type of work more enjoyable 🙂
Awesome post! I have thought for some time about getting to a place where I can “retire” to a low-key part time job until the mortgage is paid off and then go all out once we can get our expenses pretty darn low.
That could be a great path for you to pursue, especially if that low-key part-time job is doing something you enjoy that doesn’t even feel like a job.
I’ve always thought that half Mustachean plus part time work was a nice alternative to full Mustachean. And this post proves it. Thank you, sir.
Totally agree, Mr. G. My plan (ever evolving as it is) means that I’ll leanfire with portfolio of $500k and can work a few more years two days a week (with a salary about 67K). With a savings rate of 80% , I see no reason to maintain a 40% savings rate then with the PT work. The Mustachian part is a crucial part. I’ll be honest, it’s not nearly as hard as I thought it would be to get my expenses down.
Awesome post, thank you!
Thanks for the kind words, Mr. Groovy 🙂
Great post. It should be required reading for all who think they cannot afford to retire.
I can testify to the results. Wife and I semi-retired 4.5 years ago, with well under 1M in invest-able assets. I have a “hobby job” that allows total flex time if we want to turn it off and travel. We also have one SS check. Our financial needs and earned income are similar to your projections. Our assets have continued to grow each year. No job pressure-no financial pressure.
Add the numerous tax benefits of being self employed (including recently added Trump tax benefits), and life is truly good.
That’s awesome to hear, congrats on your no-pressure work situation you have set up 🙂
This is a fantastic analysis and something I’ve been hoping to find! Coincidentally, your example is similar to my plans. I’m banking on the 4% rule, but do plan to earn some incidental income once I’m done with the J-O-B. It’s amazing to see how much a small amount of income can change the results.
— Jim
Thanks for the kind words, Jim!
Greetings from Brazil (and apologizes for my English).
Thanks for this incredible post.
Your spreadsheet also addresses my main doubt about SWR: how delaying the FI for one or two years influences the successful rate of a portfolio (something like working one or two more years after FI to build a margin of safety).
Thank you! Glad you found this spreadsheet to be helpful 🙂
I was definitely surprised as well at the performance of the *15 Annual Expenses across the different time periods. Even after seeing the numbers, it still surprises me of it’s future success rates.
After all is said and done though, I will still focus on the *25 scenario:)
Terrific analysis!
Wow, thank you! My husband and I both read your previous posts on this topic and consider this information part of our top financial references. Now we’ll add your tracker as well. We had been looking for additional assessments for 30 years and under, especially one for >30 years, and now we can calculate estimates for income coming in during early retirement. Your valuable information has helped give us confidence that we’re on the right path!
Those are fascinating figures. Having a part-time job in retirement has many advantages. It makes a big difference if a person is fearful of running out of money during the drawdown phase.
Thanks for the great post. Earning some income makes a big difference. That’s one reason I won’t ever “fully retire”. I’ll have some part time work or side hustle.
Thanks for running this analysis. Kitces did some related work around how retirees with meaningful savings tend to end up with higher terminal portfolio values due to factors like self insuring (over saving in retirement) and that for traditional retirees expenses drop about 1% per year in real dollars in retirement (so 10% declines per decade).
https://www.kitces.com/blog/consumption-gap-in-retirement-why-most-retirees-will-never-spend-down-their-portfolio/
We’re going to be adding Monte Carlo and historical back testing to our retirement planning tool this year, so we’ll look at this when we do it. (btw – would love your feedback on our retirement planning tool if you are interested https://www.newretirement.com/ )
Excellent article and earning side income is something I have practiced in my early retirement. Your spreadsheets prove the importance of keeping an open mind regarding working in retirement and how it can improve portfolio longevity chances. I haven’t a static retirement income plan of anything like $15k for 20 years ($300K). I retired being open to accepting opportunities that interest me. It has worked out more as my first 5 years of my now 8 years in retirement adding income of $350K. It has definitely improved what was initially a 20X annual expense retirement portfolio.
Great post!
Just goes to show you that as long as you’re bringing in some kind of (minor) income you can walk away much sooner!
I will definitely be keeping this in mind as my stash builds up and I get antsy about leaving my 9-5 haha
Really good series of posts!
I’ve always been curious as to how much sooner those of us striving for FIRE could quit the rat race if we factored in some sort of income in addition to our nest eggs…I’m not opposed to cutting back to half-time or taking a lower paying but less stressful and/or more fulfilling job, so this is something to consider in detail.
I’ll have to spend some time tweaking the numbers and see what that results in. Thanks again!
Very informative and easy to understand article. Thanks for doing all the leg work. I’ve shared this already and plan to show my partner as we work out our savings goals! Thanks again.
I’ve not seen it worked out and presented quite like this before. I really like it! Just goes to show that even for the most risk adverse amongst us, you just got to trust your numbers and sticking in a job you might not enjoy for a few more years after you’ve reached FI just to ‘feel safer’ is such a waste of valuable time. Great work!
Very nice calculations. I’ve always been suspicious of the 4% rule. It is portrayed as if it’s some kind of law, like the law of gravity or something. If you look at the original paper by the guy who wrote about it first, he admitted later he had to make all sorts of assumptions and decisions that are not realistic.
I did some similar calculations. I started with a fixed amount in a portfolio and used the required RMD amount to see how long it would last under a few different scenarios. I think it is a good read.
(There are also several retirement calculators out there that I reviewed. One should always use a few of them because they often display different results.)
Thanks for the kind words! 🙂
Love seeing this since it is exactly what I plan to do. I already have my own business and eventually I’d like to reduce the amount of work I do there. Want to keep my skills and community engagement up without needing to overwork for money’s sake.
Thanks, ZJ! Glad you found this helpful and best of luck with your own business in the future 🙂
I love these calculations. Most of us will earn some income long after we have dropped our main hustle. The numbers are lower than most expect.
Thanks, DocG!
This is incredibly useful info! Thanks for doing so much work and handing it out for free.
No problem, Pat! Glad you liked it 🙂
This calculator is so wonderful! I’m philosophically FIRE minded but am working from a position les optimal for the hard burn then eject scenario many couples have…single income with a stay at home dad and my salary supporting our family of 5. We’re doing well but my working timeline would be so conventional if we weren’t thinking more strategically. So this calculator allows me to play around with part time options and developing alternate non-linear routes to FI. Don’t underestimate the incredible value of the hope this kind of tool gives someone like me. I CAN have more time with my family, and I can live a full life not chained to the desk despite a different starting point. So thank you.
Thanks, Em Jay! I have received a lot of positive feedback about this calculator, so I plan on making more calculators like it in the future to help people out as well. Thank you for the encouragement and best of luck on your own financial journey 🙂
wow
just recently found out about FI and still learning. This article is excellent has has given me lots of ideas in how I can use it to help me get to my FI number earlier, rather than having to strictly get to 25x income. Thanks for this
Glad you found it so useful, thanks for reading 🙂
Love these posts. I have thought for a while that a phased retirement (semi-retirement as I usually call it) is a very positive alternative to all or nothing for so many reasons. Financially yes but also socially, mentally etc.
Two related questions:
Do your calculations at all take into account social security? That is if you have 20x your annual need in retirement is that 20x plus Social Security? At age 52 I can see that SS at age 67 will be a pretty big nut after our maximum input for 20 years.
Also, would a pension be another form of earned income to consider? For us at age 65 we will be able to collect $18K post taxes annually. Would this not be very similar to earned income?
Any thoughts? Maybe another series of spreadsheets? Pretty please.
These calculations don’t take into account social security since nobody knows the future of it. Pensions are also not considered here. In that sense, these calculations could be seen as conservative, if you plan on having either of those income streams in retirement. I might take a look at those calculations in the future in a separate spreadsheet. Thanks for the feedback 🙂