
6 min read
My most popular visual on this blog is The Early Retirement Grid. It’s a simple grid that shows how long it will take you to achieve financial independence based on the following assumptions:
- Financial independence is defined as 25 times your expected annual expenses during retirement
- You start with a net worth of $0
- You invest the difference between your post-tax income and expenses each year and earn 5% annual returns on those investments
Here’s the grid:
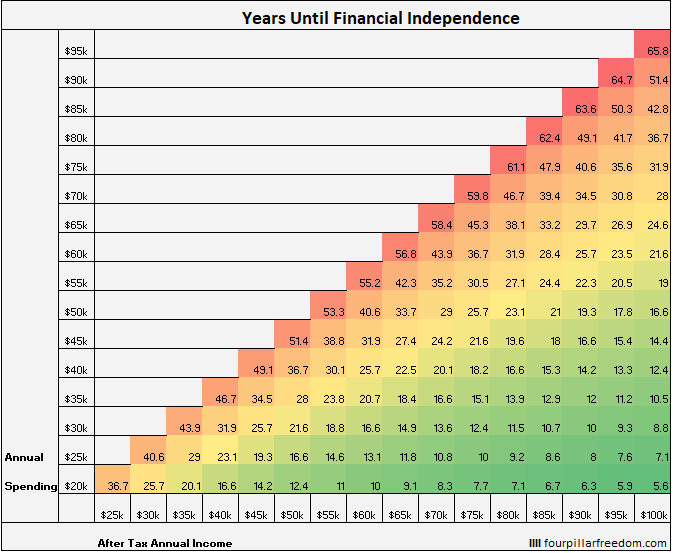
This grid has gained some renewed attention due to being featured in Get Rich Slowly and MarketWatch this past week. As a result, I’ve had a few readers reach out to me with a some requested additions to the grid:
- “Can you make the annual returns on the grid adjustable? Currently the grid assumes that you earn 5% annual returns. I’d like to see how the numbers change if instead you assume 3%, 7%, or some other annual rate of return.”
- “Can you make the starting net worth adjustable? Currently the grid assumes that you start with a net worth of zero. I’d like to see how the numbers change if my net worth is negative, or if I already have saved $100k, $250k, etc.”
- “Can you make the definition of financial independence adjustable? Currently the grid defines F.I. as having 25 times your annual expenses. I’d like to see how the numbers change if I only plan on saving 15 times my annual expenses before transitioning to part-time work, or 35 times my expenses if I want to live a little more lavishly once I retire.”
- “Can you make the income axis go above $100k? As a dual-income household, our annual post-tax income exceeds $100k and I’d like to see the numbers on the grid for higher incomes.”
So, I decided to make all of these additions to the existing grid. I made the starting net worth, the annual returns, and the definition of F.I. all adjustable. I also extended the income axis to go up to $200k.
You can use the interactive grid below to fiddle around with the assumptions under the pink boxes on the left-hand side of the grid:
For those interested in seeing exactly how this grid was made along with the calculations on the back end, you can download the Excel Spreadsheet for free here.
Fiddling Around with Assumptions
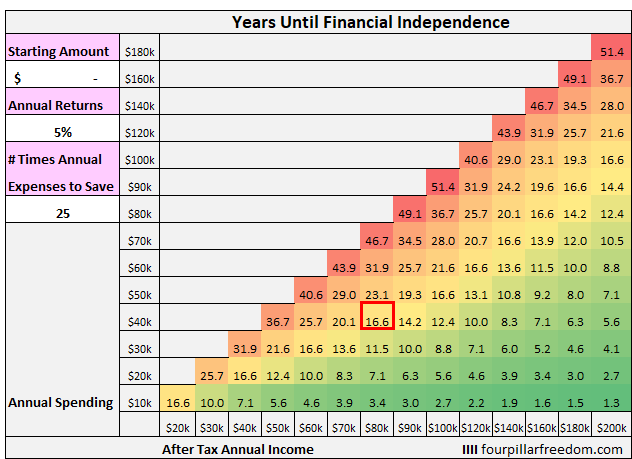
Let’s fiddle around with some of the assumptions of the Early Retirement Grid to see how the numbers change. For simplicity, I’ll walk through some examples using a household that earns $80k post-tax and spends $40k annually.
The Impact of Your Starting Net Worth
If we assume that this household starts with a net worth of $0, then it will take them 16.6 years to achieve financial independence:
Instead let’s suppose that this household starts out with $80,000 in debt. Let’s assume that they’ll have to pay $100,000 towards that debt once we include interest, so essentially they’re starting with a net worth of -$100,000. According to the grid, it will take them 19.4 years to achieve financial independence:
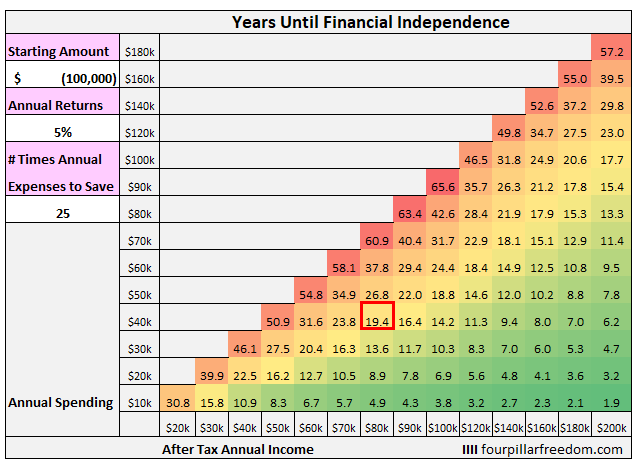
That number is actually pretty encouraging. A household that starts with a six-figure negative net worth only has to work an additional three years to hit F.I. if they’re able to consistently save and invest half of their income each year.
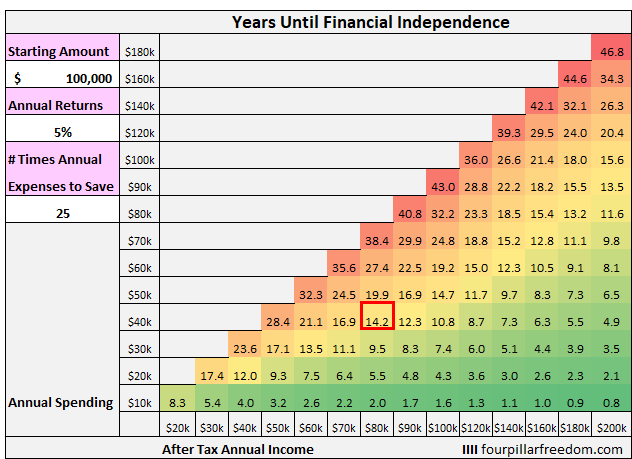
On the flip side, let’s consider instead if this household started out with a positive net worth of $100,000. In that case, it would only take them 14.2 years to hit financial independence:
The Impact of Annual Investment Returns
Now let’s consider the impact of annual investment returns. We saw earlier that this household could achieve F.I. in 16.6 years, assuming they earn 5% annual returns.
If instead they earn just 3% annual returns, it will take them 18.9 years to hit F.I.
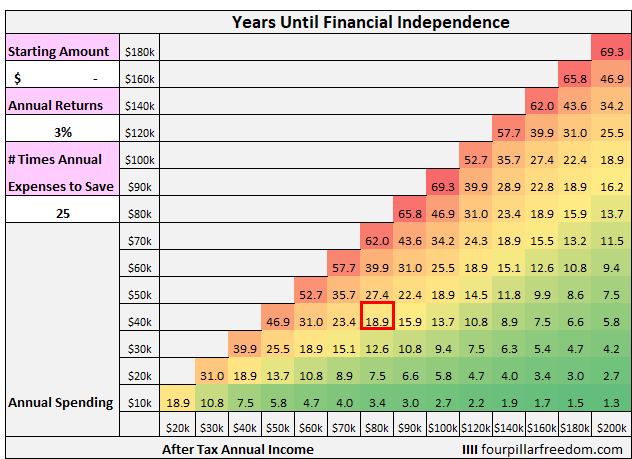
By earning 2% lower annual returns, they need to work for an additional 2.3 years to hit their F.I. number.
Consider instead if they earn 7% annual returns, which is roughly the S&P 500 long-term annual average rate of return. In this case, they’d be able to reach F.I. in 15 years:
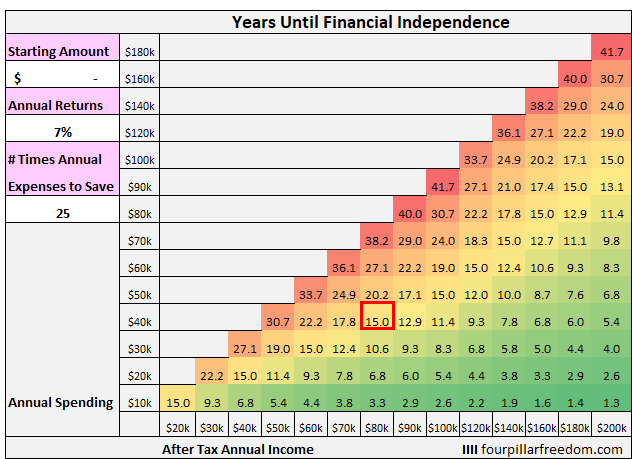
Note: A household that saves and invests 50% of their income at a 7% annual rate of return can achieve F.I. in 15 years at any income level.
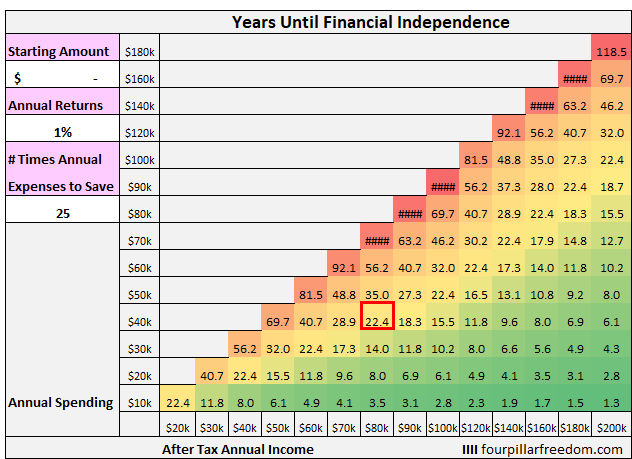
And just for kicks, let’s consider if this household earned pathetic 1% annual investment returns. In this case, it would take them 22.4 years to reach F.I.
The Impact of Your Target Net Worth
I’ve written before about how saving up 25 times your annual expenses and never working again might not be optimal for your happiness. For many people, their goal isn’t to save up enough money to never work again, but rather to save up enough to feel comfortable with transitioning to part-time work or simply a lower-paying role where they have more freedom in their life.
For these people, it might be interesting to see how long it would take them to save up just 15 or 20 times their annual expenses.
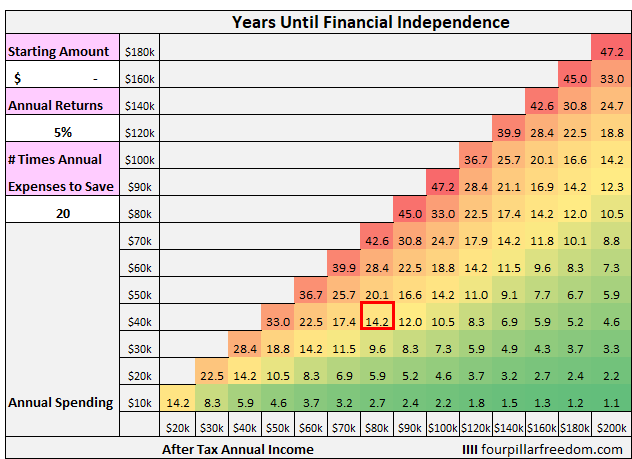
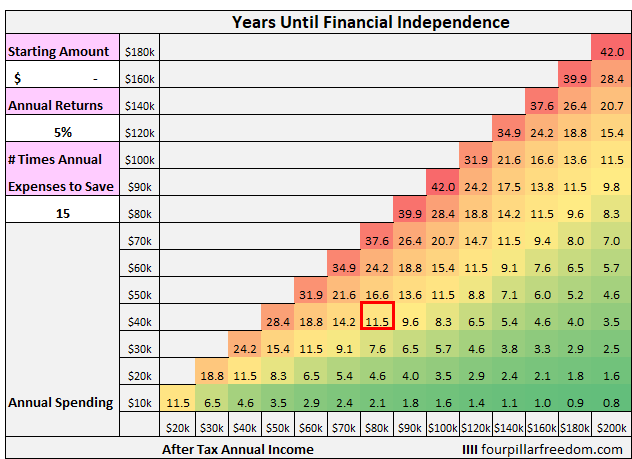
Using the same household as before that earns $80k post-tax and spends $40k annually, suppose they only wanted to save up 20 times their annual expenses. In this case, it would take them 14.2 years to do so:
And if this same household wanted to save up just 15 times their annual expenses, it would only take them 11.5 years:
Conclusion
It’s fascinating to see how changing the assumptions of the grid can have an impact on the number of years it takes to achieve financial independence.
Feel free to fiddle around with the numbers in the interactive grid above or download the actual spreadsheet I used to create the grid.
- The Ad Revenue Grid - August 6, 2021
- Attract Money by Creating Value for a Specific Audience - July 13, 2021
- The 5-Hour Workday - March 26, 2021
Full Disclosure: Nothing on this site should ever be considered to be advice, research or an invitation to buy or sell any securities, please see my Terms & Conditions page for a full disclaimer.

Awesome addition to some of your best work Zach!
Thanks Kit!
Love this! Bravo!!
Thanks Rob!
Another excellent post, Zach. It’s really interesting to see the impact of different annual returns.
Thanks Jock! Agreed, it’s interesting to see how much annual returns actually matter.
This is awesome. Thanks for making it so much more applicable to my life 🙂
Sure thing! I’m glad you like it 🙂
Excellent content as usual, Zach. The visual representations of the data make all the difference. I’ll be sending this on to friends who would love being able to adjust the figures to their own scenarios.
Thanks Michelle! Glad you enjoyed the grid and thank you for sharing it with others 🙂