
4 min read
Here is a look at the price of the S&P 500 from 1950 to 2018:
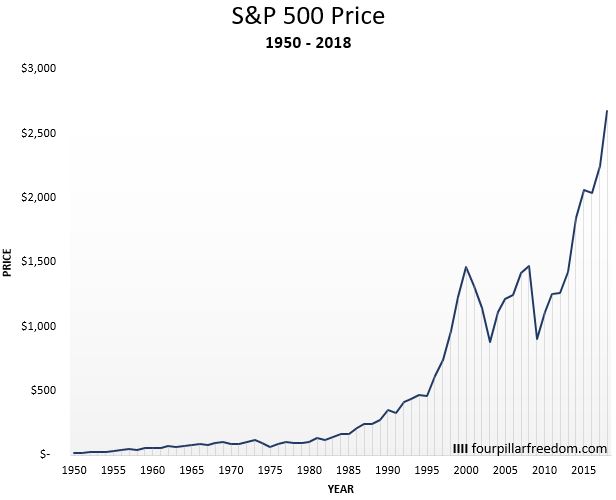
This simple graph shows what you can expect when you invest in the stock market: Over time, market prices generally increase, but the path to higher prices can be bumpy.
This bumpiness is known as “volatility” and it’s the reason many people are scared to invest in the stock market. In particular, many people fear potential market drops.
This leads to an interesting question: When the stock market does drop, how long does it take for prices to recover?
To answer this question, I downloaded historical yearly S&P 500 prices from 1950 – 2018 and looked at every instance where the S&P 500 dropped from previous highs and analyzed how long the subsequent recovery took.
It turns out that there were 11 periods from 1950 – 2018 when the S&P 500 dropped from its previous all-time high:
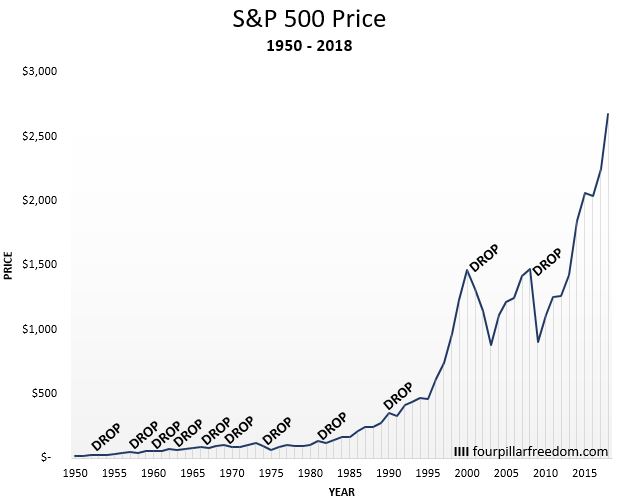
It’s a little hard to see the drops from 1950 – 1980 so let’s convert the y-axis to a log scale:
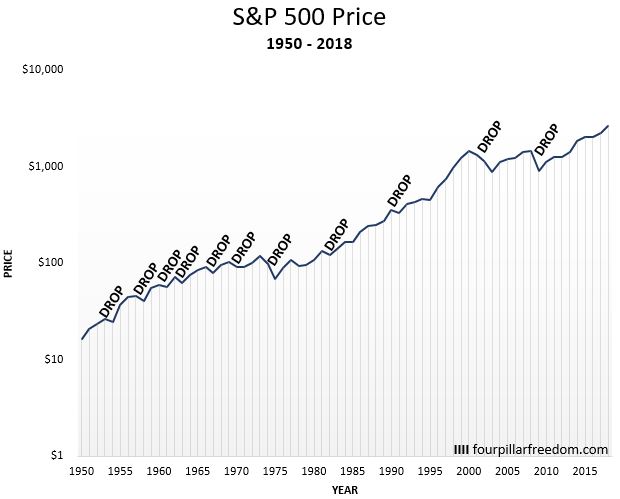
Now let’s check out how long each drop took to recover to the previous all-time high:
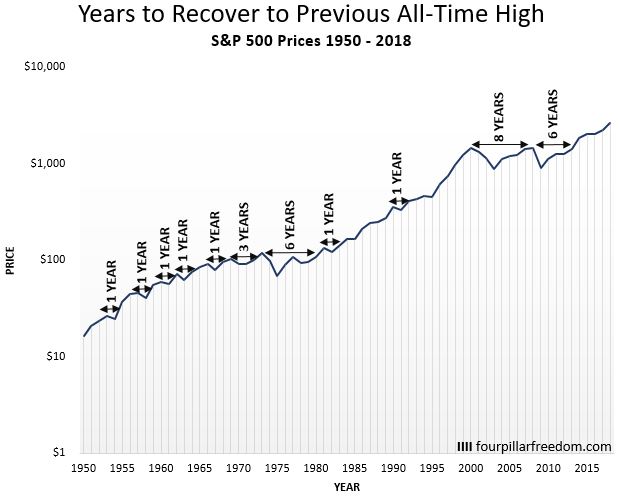
How Long it Took for the Stock Market to Recover
In 7 of the 11 drops, it only took one year for the S&P 500 to recover to its previous all-time high price.
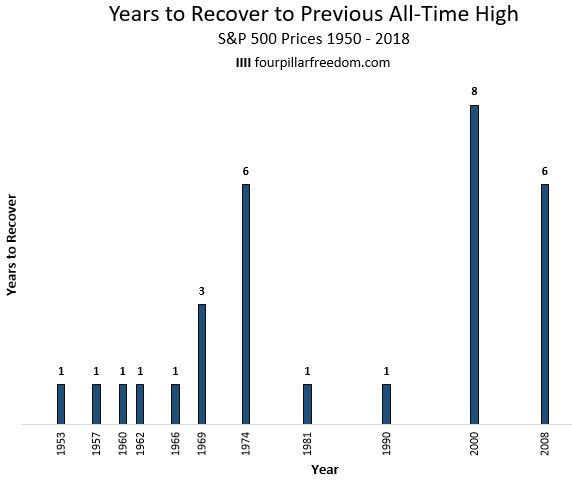
In the most extreme drop, it took 8 years for S&P 500 prices to recover after the dot-com bubble burst in 2000, which was immediately followed by the crash of 2008. Following that crash, it took about 6 years for prices to recover to their previous all-time highs.
Closing Remarks
- In general, the stock market is incredibly resilient in its recoveries from drops. In 7 of 11 historical drops, it only took one year for the S&P 500 to recover to its previous all-time high.
- During any time period since 1950, you could have closed your eyes for a decade and re-opened them to find the S&P 500 at a higher price.
- Market drops have become less frequent over time, but the severity of the drops has increased.
- Historically, investors who have been able to avoid selling during drops have been rewarded by the market over the long haul.
Related Posts:
Here’s How the S&P 500 Has Performed Since 1928
Can the Previous Decade of Stock Market Returns Predict Future Returns?
How to Think About the Role the Stock Market Plays in Your Finances
- The Ad Revenue Grid - August 6, 2021
- Attract Money by Creating Value for a Specific Audience - July 13, 2021
- The 5-Hour Workday - March 26, 2021
Full Disclosure: Nothing on this site should ever be considered to be advice, research or an invitation to buy or sell any securities, please see my Terms & Conditions page for a full disclaimer.

Interesting Zach. Nicely put together and easy to follow. One question & one comment:
How did you define a drop from an all time high? A correction of 10%, bear market of 20%, or something different?
My instinct was that the recent recoveries would have been quicker with the pace things move at today versus 20-50 years ago. I was clearly wrong. As you indicate the recent drops were much bigger requiring a longer recovery period.
Tom
Hey Tom, great question! I define a “drop” as any time the S&P 500 opened the year at a lower price than the previous year, so in some cases these were only tiny drops (<5%) while others like the financial crisis of '08 were massive drops (>36%).
Hi Zach
As always, great read. Stock markets are really very resilient and recover quite nicely from a drop – and in the meantime there are always plenty opportunities to buy stocks cheaply.
Cheers
Good article and good information. Certainly reinforces the “buy and hold” strategy for most folks.
Still, I’m concerned that the last 2 market drops took so long to recover, in comparison to the previous ones. I think that is because so many more are in the market, bidding up prices and making the market jump. I wouldn’t be surprised after the next drop (and yes, there will be another drop) that it doesn’t take the same 6-8 years to come out.
We will see.