This week features a video on why Los Angeles is one of the best cities for bike riding, an article on why one woman wouldn’t buy her wedding rings again, and much more…
Ever since I was young I thought it was odd that the normal way to spend one’s life was working at a job 40 hours per week for 40 years…
This chart shows how the average American household spends their money each year…
This week features an interview with author Cheryl Strayed on how to overcome life’s obstacles with tenacity, an article on why the perfect time to start living frugally is now, and much more…
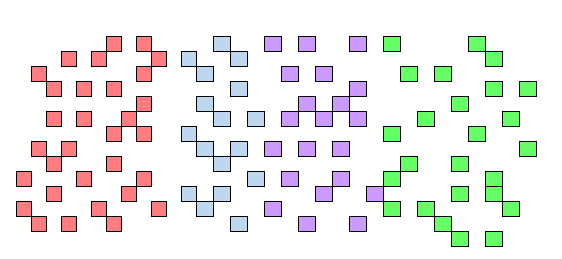
“The Tiny Blocks of Financial Independence” is a visualization tool that uses tiny blocks to illustrate the concept of financial independence…
Recently I was looking at my credit card statements and realized that I have spent over $400 on Chipotle alone this year…
This past weekend I moved into my first apartment ever. Here’s a brief tour of it…
I went back and used the historical returns of the S&P 500 to calculate exactly how long it would have taken to reach F.I. based on various savings rates…
This week features an interview with a 28-year-old who has 90% of her net worth invested in real estate, an insightful video about the relationship between money and happiness, and much more. ..
“FOUR Visuals” is a new series that features interactive financial visualizations and tools. I’m proud to present the first tool in this series: The Financial Independence Calculator
It’s possible to achieve maximum happiness without achieving 100% passive income…
Here’s how long it will take you to reach financial independence, using tiny blocks as visual aids…
Recently I got my hands on some net worth data for U.S. age brackets. I decided to make a grid to visualize the data…


