Here is a visualization of every dollar I spent in 2017…
Category: Pillar IV: Finance
Yesterday I shared an interactive chart that lets you visualize potential future S&P 500 returns…
This interactive chart lets you visualize potential future S&P 500 returns…
Here’s why you should be hoping for market drops if you have a long investing horizon…
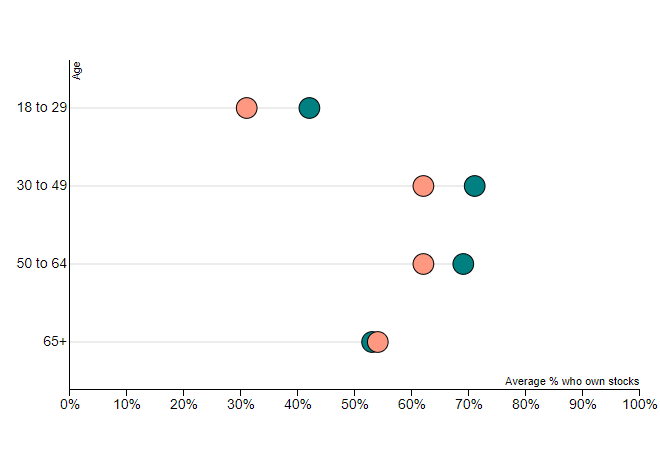
Here is an analysis of U.S. stock ownership before and after the financial crisis…
If you’re looking to increase your income, there are two paths you can take…
Here is an interactive visualization of every individual stock in the S&P 500…
Here’s a recap of how my income streams grew in 2017…
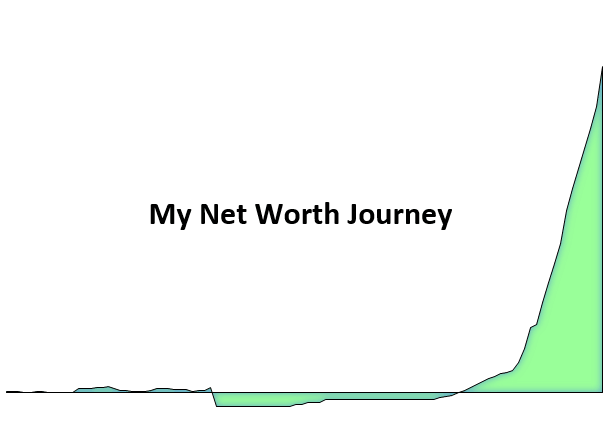
Here’s a look at my net worth journey over the last 24 years…
The best way to find success is through being pretty good at two complementary skills, as opposed to being excellent at one…
Here’s an in-depth analysis of how every stock in the S&P 500 performed in 2017…
Here’s a $2 meal I cook almost everyday that helps keep my food expenses low…
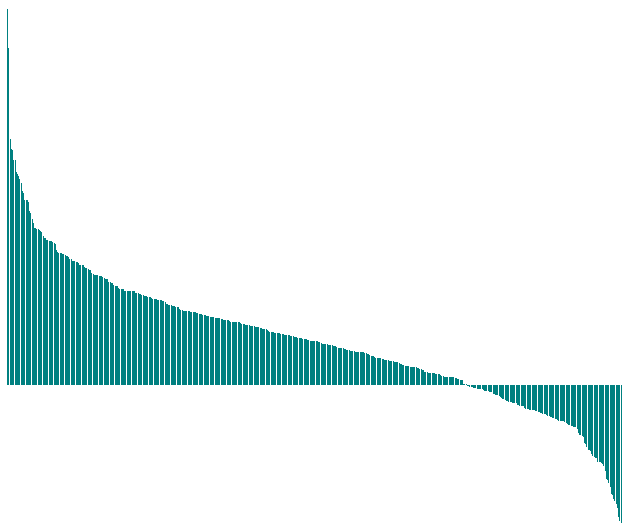
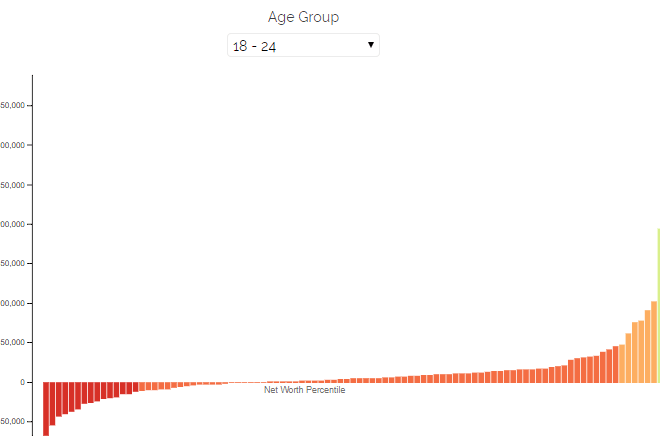
Here’s an interactive visualization of the net worth of Americans…


