This chart shows how the average American household spends their money each year…
Category: Pillar IV: Finance
“The Tiny Blocks of Financial Independence” is a visualization tool that uses tiny blocks to illustrate the concept of financial independence…
I went back and used the historical returns of the S&P 500 to calculate exactly how long it would have taken to reach F.I. based on various savings rates…
“FOUR Visuals” is a new series that features interactive financial visualizations and tools. I’m proud to present the first tool in this series: The Financial Independence Calculator
Here’s how long it will take you to reach financial independence, using tiny blocks as visual aids…
Recently I got my hands on some net worth data for U.S. age brackets. I decided to make a grid to visualize the data…
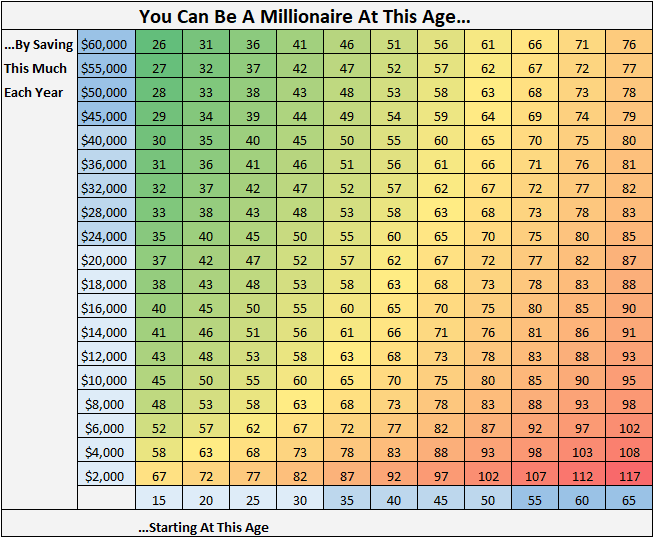
This grid shows at what age you can become a millionaire, based on your yearly savings and what age you start saving…
Investing returns are important, but what’s even more important is how much you’re actually investing…
Here’s how to visualize financial independence using tiny red and green blocks…
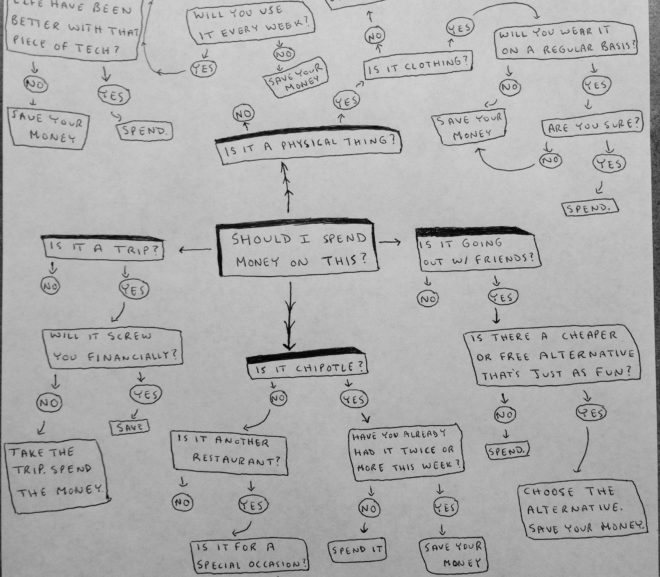
Here’s a flow chart of what takes place in my head before I decide to spend money…
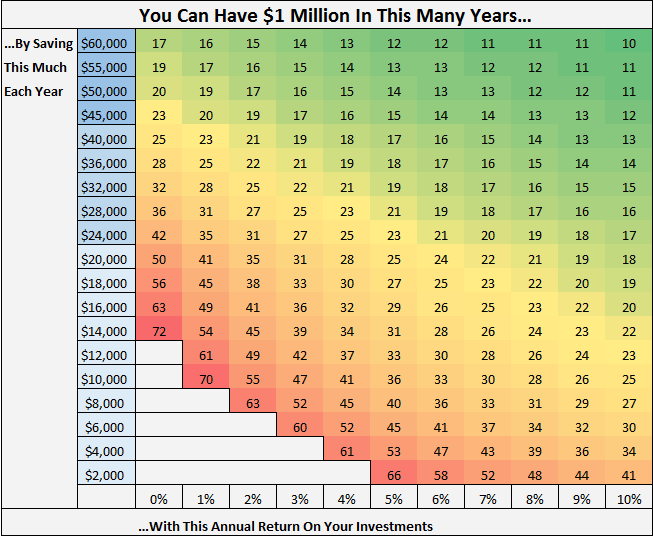
This grid shows how many years it will take you to save $1 million based on how much you save each year and your annual return on your investments…
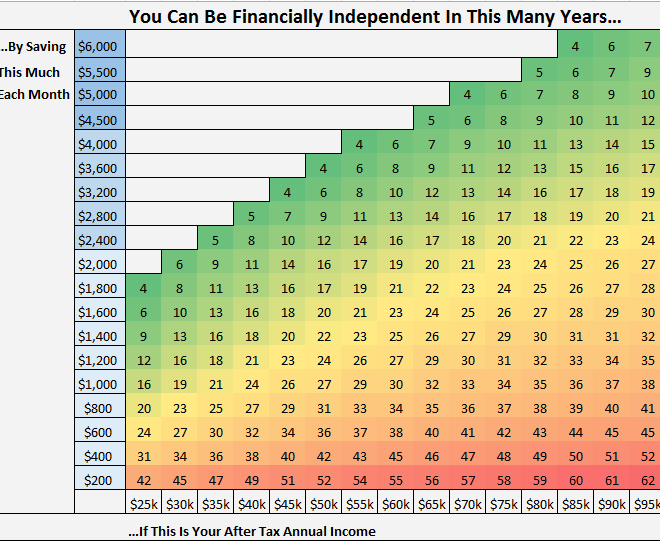
This grid shows how many years it will take you to reach F.I. based on your after tax annual income and how much you save per month…
I used actual historical S&P 500 returns to find the minimum savings rate necessary to reach F.I. by 2017…

